
Chetan
-
Content count
22 -
Joined
-
Last visited
Posts posted by Chetan
-
-
Hi the solution worked when I reverted back fusionchart version to 3.2.1-release
But I cannot revert back to old fusionchart version I have latest version fusioncharts/3.2.4-release.8565
Reason being the forum post
http://forum.fusionc...9020#entry49020
When I try the ajax solution from above post with @version fusioncharts/3.2.4-release.8565
I get this errors from fusionchart.js and I dont see any graph but blank page.
- Uncaught TypeError: Cannot read property 'dynamicDataRoutingEnabled' of undefined FusionCharts.js:77
- Uncaught TypeError: Cannot read property 'renderer' of undefined FusionCharts.js:155
<br class="Apple-interchange-newline">
And for the suggestion item,
How about a demo of asp.net and ajax for each release?
Could not find a simple demo for the latest release in documentation.
Thanks,
Chetan Patel
Hi,
Please refer this post:
http://forum.fusionc...h__1#entry42221
If this doesn't help, please feel free to revert.
-
When the fusionchart is within the update panel and rendered using the method in C# codebehind
Response.Write(FusionCharts.RenderChart("Fusioncharts/MSColumn3D.swf", "", graphString.ToString(), "abcdefadfa", "100%", "100%", false, true));
Error is thrown: The message received from the server could not be parsed. Common causes for this error are when the response is modified by calls to Response.Write(), response filters, HttpModules, or server trace is enabled.
Here it talks its because of response.redirect() in the updated panel.
http://forums.asp.net/t/1066976.aspx/1
How do I avoid this conflict?
How do I render the chart without response.write()?
Thanks in advance.
-
The problem was the space in datapoint value
Instead of this working node
<set value='31.47' />
The some formatting reason it had space like this <set value='31.47 ' /> which didn't render the graph properly..
And btw Bindhu, I had upgraded with help of email to support team. They showed me a way to do the upgrade.
Hi Chetan,
If you do not want to use the trial version, please purchase the licensed version from the link below,
http://www.fusioncharts.com/buy/
The licensed version files come with out the watermark.
Hope this helps!
-
Hello FusionChart Team,
I cannot use trail version for my app. I would please need a fix for the FC version 3.2.1 I have.
Hi Chetan,
You may download the latest trial version from the link below,
www.fusioncharts.com/download/trials
Hope this helps!
-
So I have FC version 3.2.1. Can you please provide me the fix for that version? Or what is the solution? How do I upgrade?
-
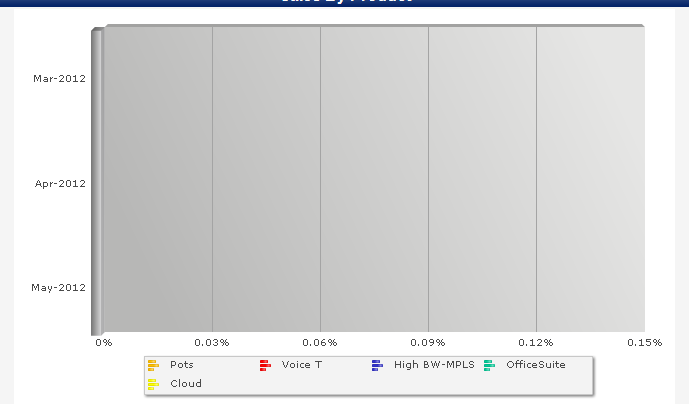
Whats wrong with this XML that I don't see data plot on the MSBAR3D graph?? Please help me asap.
Does not render in SWF mode however does render in javascript mode using FusionCharts.setCurrentRenderer('javascript');
Tried IE, chrome, mozilla
FusionChart enterpirse version Details
* @license License Information at <http://www.fusioncharts.com/license>
*
* @author FusionCharts
* @version 3.2.1-release
*
* Third-party attributions:
* SWFObject v2.2 <http://code.google.com/p/swfobject/>
* JSON v2 <http://www.JSON.org/js.html>
* Firebug Lite 1.3.0 <http://getfirebug.com/firebuglite>
* jQuery 1.4.2 <http://jquery.com/>
////////////////////////////////////////////////
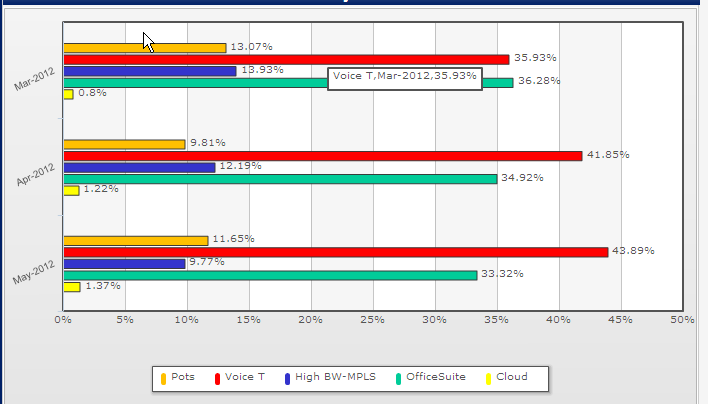
- <chart caption=" " showLabels="1" showValues="1" decimals="2" numberPrefix="%">
- <categories>
<category label="Mar-2012" />
<category label="Apr-2012" />
<category label="May-2012" />
</categories>
- <dataset seriesName="Pots" color="FFC000" showValues="1">
<set value="14.81" />
<set value="9.70" />
<set value="12.16" />
</dataset>
- <dataset seriesName="Voice T" color="FF0000" showValues="1">
<set value="39.78" />
<set value="47.42" />
<set value="39.35" />
</dataset>
- <dataset seriesName="High BW-MPLS" color="3333CC" showValues="1">
<set value="12.11" />
<set value="10.56" />
<set value="11.68" />
</dataset>
- <dataset seriesName="OfficeSuite" color="00CC99" showValues="1">
<set value="32.84" />
<set value="31.22" />
<set value="35.68" />
</dataset>
- <dataset seriesName="Cloud" color="FFFF00" showValues="1">
<set value="0.46" />
<set value="1.10" />
<set value="1.14" />
</dataset>
</chart>
-
Javascript upgrade solved the problem.
It would be great if the licensed users are notified about the available upgrades.
Thanks,
Chetan Patel
Hi,
This issue has been fixed. Please send us your Order ID at [email protected] quoting this forum thread link and we would get back to you with the solution to this.
Looking forward to your feedback.

-
Hi i have posted this issue on other html rendering issue by abhilash.. Please find the XML attached there.
We have bought fusionchart v3.2... now we need support and updates.. how do we get updates?
Hi Chetan,
We are unable to replicate the issue could you please post a simple HTML sample[Zipped].
mean while you may try FusionCHarts.js & HighCharts.js from our latest released PowerCharts Evaluation pack.
-
I am using the latest javascript files what I got from licenced Version 3.2 . Where can I get the latest javascript files.
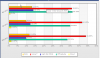
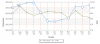
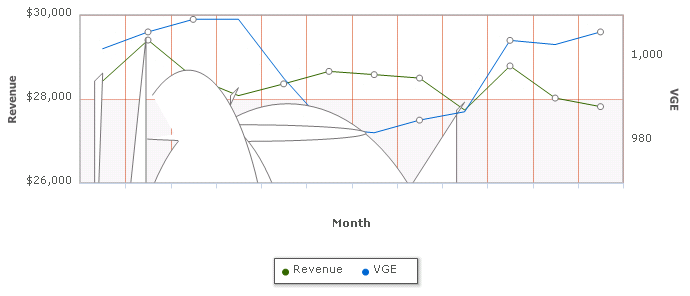
I am attaching view of HTML rendered graph vs flash rendering of same XML.. Also find the attached XML text. Chart used is MSCombiDY2D.swf
Please give the feedback asap. Need to launch the version for iPad on priority basis.
Hi Chetan,
Thanks For your post.
Please make sure that you are using the latest JavaScript Files.
If still the issue exist then please send us the XML for the chart generated in your server side code.
Ipad user interface detect mouse over for the first tap and click for the next tap. This is an internal behavior of ipad browser to get the usability of mouse over and mouse click event without a mouse.

-
Recently bought Fusioncharts Enterprise Bundle. Definately looking for FusionWidgets HTML5.. It is show stopper right now for developers to use widgets. Any estimates on when can we expect it?
-
Thanks Angie but rotateValues="1" or rotateLables="1" doesnt cut the meat
 . Well using \n Line character did the trick for x-axis Label multiple lines..
Can you please answer other question about minimum Height for stackedColumn graph so that the datavalues are atleast readble when the difference is tooooo big...
-
Please help me out on this. We have to make a management decision to buy fusioncharts or not!!!
-
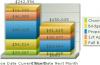
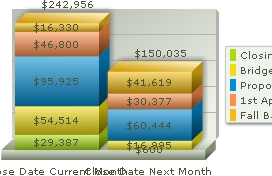
How can I bold (Or rather apply style) to SumValue of stackedColumn3D?
Also is there a way to define minimum height for stack? Look at the image if the stack value difference are huge it over laps the value text.
-
How can I bold (Or rather apply style) to SumValue of stackedColumn3D?
-
Hi Abhilash,
Are you using server side rendering? I am having an issue of no x-axis labels while I use javascript rendering from server side.
Are you getting similar issue?
-
Thank you Sanjukta.
How come it shows the x-axis labels in the javascrip demo?
Please let me know when can I expect the fix.
-
Please help me out here. BTW I am using server side rendering to render the graphs.
-
I checked the version is infact 3.2.1 and redeployed everything but no luck
. Still not showing the x-axis on javascript rendering and No trendline labels. Is it space issue? -
How do I know my version? I have downloaded latest evaluation version. Planning to buy, but atleast it should work on evaluation first.
Hi,
This is a JavaScript issue that has been fixed in the FusionCharts v3.2.1.
Could you please upgrade to the latest version, i.e, FusionCharts v3.2.1 to avail the few JavaScript fixes?
Hope this helps.
-
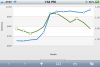
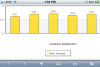
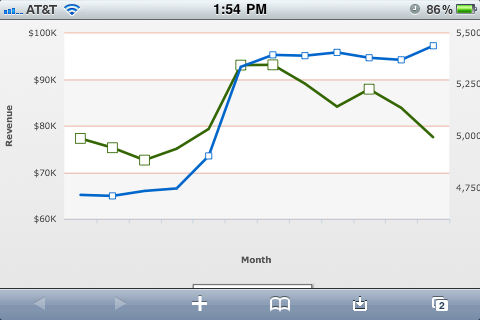
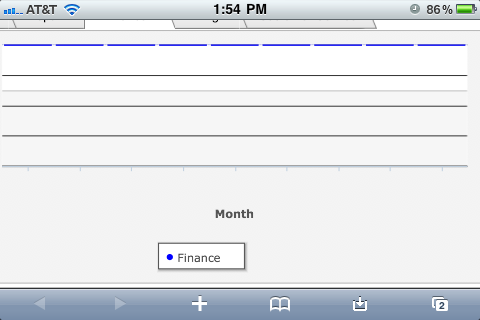
I am using MSColumn3D , MSLine, MMSCombiDY2D charts, when renedered on flash works great ; But when rendered on iPhone, iPad or simply on IE with JavaScript rendering, x-axis are not showing up. Attaching images from Iphone rendering.


Alternative To Fusion Chart Render Method Response.write(Fusionchart.render())
in FusionCharts Jobs and Consultation
Posted · Report reply
Any update on the issue? Would appreciate the early response to the issue.