
yokie_joe
-
Content count
5 -
Joined
-
Last visited
Posts posted by yokie_joe
-
-
Hi,
Thanks for the reply.
The code you sent worked on both Chrome and FF.
I looked at the source code for the html file you attached.
It explictly stated to set Javascript as the renderer:
FusionCharts.setCurrentRenderer('javascript');
I have added this line of code to the previous code I posted.
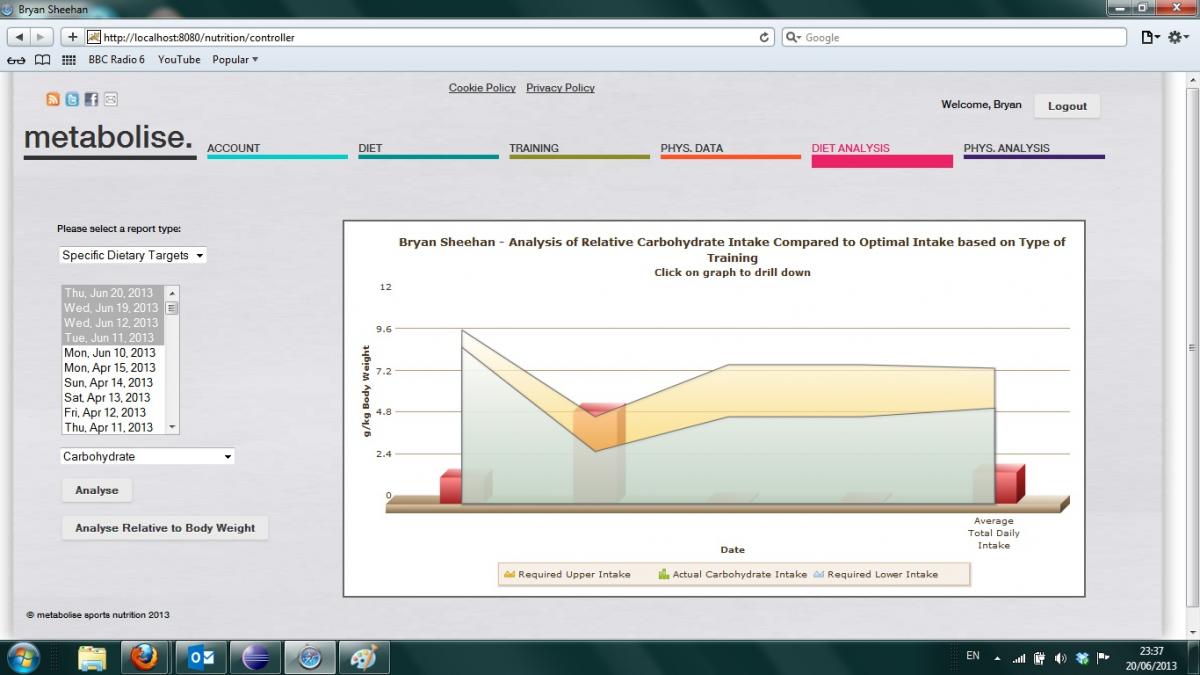
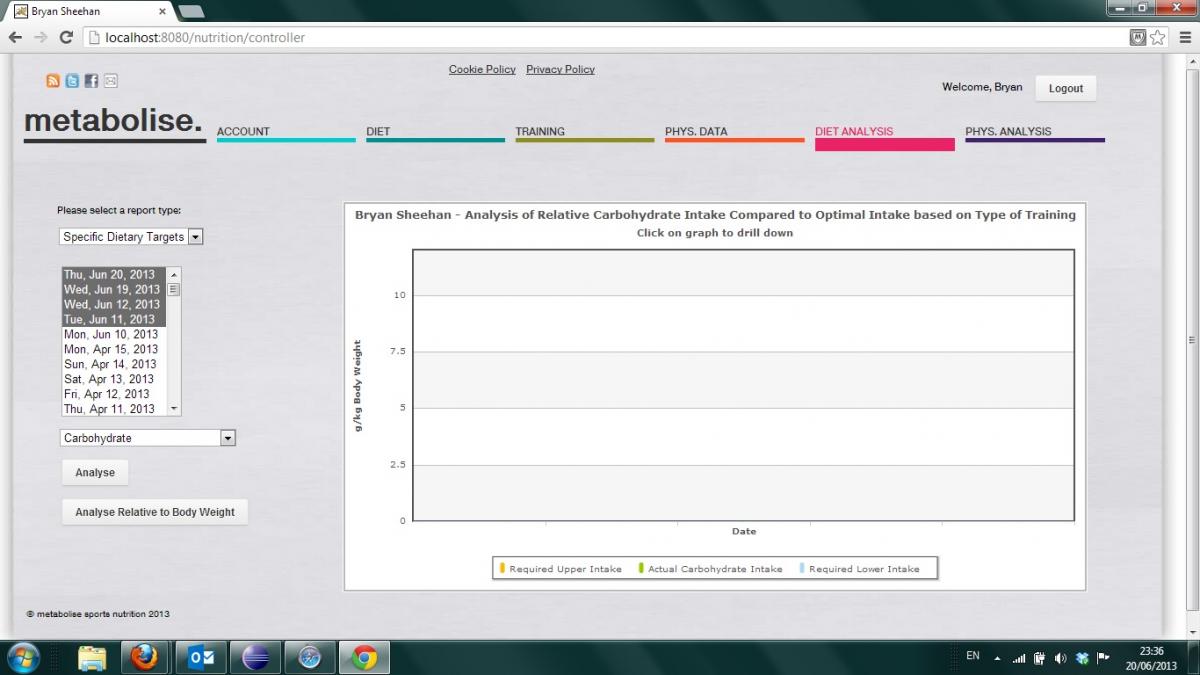
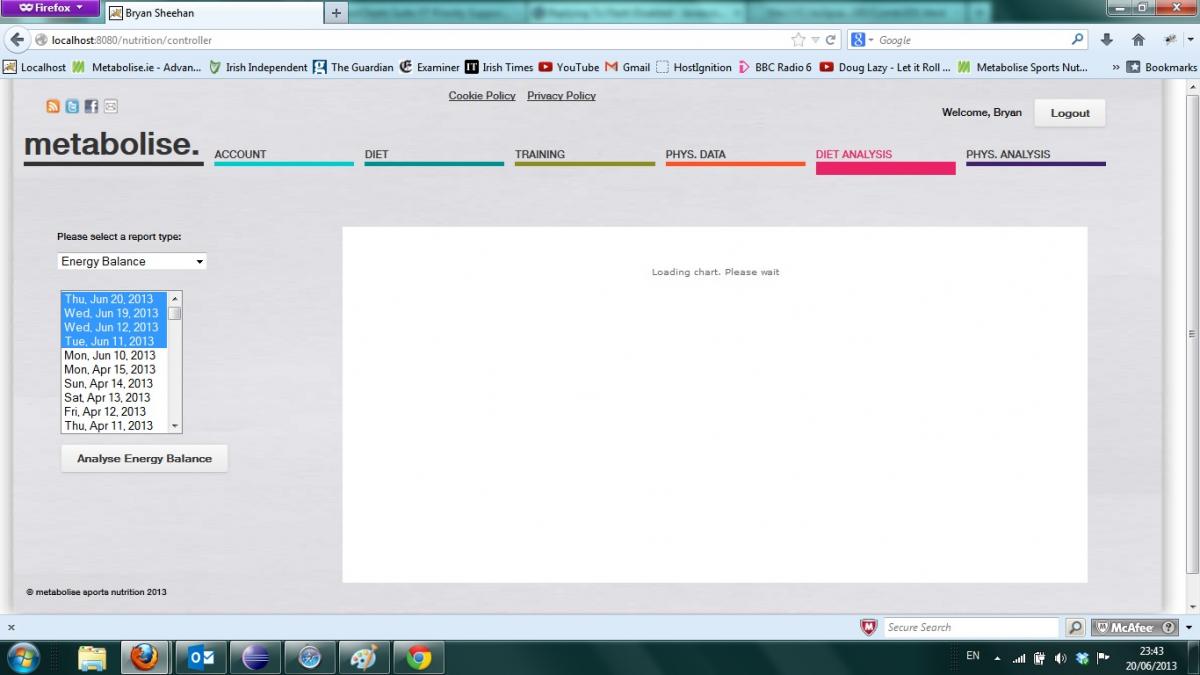
I have attached screenshots from three different browsers.
It displays correctly in Safari, but not on FF or Chrome.
I am getting the axes on Chrome, but other graphics (bar, area) are not displaying.
Nothing is displaying on FF except the container.
Kevin

-
On further inspection, it appears that only the folowing chart types are not working properly in FF:
MSCombi3D
In Chrome, the followng chart types are not working:
Column3D
MSColumn3DLineDY
MSCombi3D
-
I have disabled Flash on the following browsers:
Safari
Chrome ver 27
IE
Firefox ver 21.0
to see if javascript only charting capability is working.
It works with Safari and IE, but not with Chrome or Firefox. I am using the latest version of FusionCharts and the code is pasted below.
Can you please help me as to why charts aren't rendering in Chrome and FF.
Thanks,
Kevin
<html> <head> <LINK REL=StyleSheet HREF="stylesheet/analysis.css" TITLE="Contemporary"> <LINK REL=StyleSheet HREF="stylesheet/stylesheet.css" TITLE="Contemporary"> <meta http-equiv="Content-Type" content="text/html; charset=ISO-8859-1"> <script type="text/javascript" src="FusionCharts/FusionCharts.js"></script> <!-- <script type="text/javascript" src="FusionCharts/FusionCharts.HC.Charts.js"></script> <script type="text/javascript" src="FusionCharts/FusionCharts.HC.js"></script> <script type="text/javascript" src="FusionCharts/jquery.min.js"></script> --> <title>Graph It</title> <script type="text/javascript"><!-- $(function() { $( "#chartContainer" ).resizable(); }); function checkForMessage() { if (false == true) { alert("null"); } } // --></script> </head> <body onLoad="parent.hideProgressbar(); checkForMessage();"> <div id="chartContainer"></div> <script type="text/javascript"> var myChart = new FusionCharts( "FusionCharts/MSCombi3D.swf", "myChartId", "100%", "100%", "0", "1" ); myChart.setXMLData('<?xml version="1.0" encoding="UTF-8" standalone="no"?><chart adjustDiv="1" animation="1" autoAlignTickValues="1" bgAlpha="0" bgColor="FFFFFF" canvasBgAlpha="0" caption="Bryan Sheehan - Energy Balance over 1 day(s) (Wed, Jun 19, 2013 to Wed, Jun 19, 2013)" endAngX="15" endAngY="-15" exeTime="1.5" formatNumberScale="0" manageValueOverlapping="1" numDivLines="4" numVisiblePlot="4" placeValuesInside="1" rotateValues="0" showBorder="0" showLabels="0" showValues="0" showYAxisValues="1" startAngX="0" startAngY="0" subCaption="Click and drag chart to rotate" tickvaluedistance="2" xAxisName="Date" yAxisMinValue="0" yAxisName="Energy Intake/Expenditure (kCal)" zGapPlot="50"><categories><category name="2013-06-19"/></categories><dataset color="AFD8F8" seriesname="Energy Expenditure"><set name="2013-06-19" value="3410"/></dataset><dataset color="99CC00" seriesname="Energy Intake"><set name="2013-06-19" value="126"/></dataset><dataset color="F6BD0F" seriesname="Energy Surplus/Deficit"><set name="2013-06-19" value="-3.3E+3"/></dataset></chart>'); myChart.render("chartContainer"); </script> </body> </html> -
Hi there,
I have created an MSCombi3D chart.
However, if the user wants to be able to rotate the chart, they need to right click on the chart and click on the "Enable Rotation" option in the context menu.
Is it possible for me to set "Enable Rotation" in my code so that the user doesn't have to click on the context menu?
Thanks,
Kevin
Flash Disabled - Javascript not working
in Javascript Problems
Posted · Report reply
Hi Haritha,
I discovered the problem with FireFox.
I was calling a Javascript function in the body "onload" event.
When I removed this, the chart renders properly in FF.
So, FF is OK now.
I have removed the CSS from the web page.
I have run in Chrome but am still getting an error.
I get the following error in the Javascript console:
Uncaught RuntimeException: #25081850 myChartId::RendererManager Error >> There was an error rendering the chart. Enable FusionCharts JS debugMode for more information.
FusionCharts.js:15
I have attached the webpage.
Thanks,
Kevin