
MartinS
-
Content count
57 -
Joined
-
Last visited
Posts posted by MartinS
-
-
Not an ideal solution, but as I cannot wait for a response as the work is extremely urgent, I have implemented the following:
// get xml for chart...
string xmlFusion = FusionCharts.RenderChartHTML(
fullPathSwf = "/CustomControls/ResultsGraphPanel/Charts/MSColumn2D.swf",
string.Empty,
xmlChartString,
"MyFusion_Chart",
"650",
"350",
false,
true,
true);

// strip out any odd character implementations...
xmlFusion = xmlFusion.Replace("%2525", "%25");
xmlFusion = xmlFusion.Replace("%2526", "%26");
xmlFusion = xmlFusion.Replace("%252f", "%2f");
If I'm missing something that avoids me having to do this, then please let me know.
Martin
-
Hi
Yes, as I stated above, we are using renderChartHTML to generate the chart Xml. I assume I am already encoding the special characters?
What is the difference when switching to renderChart?
Currently the output from RenderChartHTML is loaded into a literal control and displayed - will this still work with renderChart?
Here are the parameters i am using in RenderChartHTML:
fullPathSwf = "/CustomControls/ResultsGraphPanel/Charts/MSColumn2D.swf",
string.Empty,
xmlChartString = see below,
"MyFusion_Chart",
"650",
"350",
false,
true,
true)
This is the code it generates:
<!-- START Code Block for Chart FusionChart_Chart --> <object id="FusionChart_Chart" classid="clsid:d27cdb6e-ae6d-11cf-96b8-444553540000" height="350" width="650" codebase="http://fpdownload.macromedia.com/pub/shockwave/cabs/flash/swflash.cab#version=8,0,0,0" > <param name="movie" value="/CustomControls/ResultsGraphPanel/Charts/MSColumn2D.swf"> <param name="FlashVars" value="®isterWithJS=1&chartHeight=350&DOMId=FusionChart_Chart&dataXML=<chart animation='1' bgAlpha='0,0' showBorder='0' useRoundEdges='1' setAdaptiveYMin='1' numberScaleValue='1000,1000,1000' numberScaleUnit='K,M,B' caption='LGPT 2010 Base (23) 5%266 0.5' xAxisName='' yAxisName='' anchorAlpha='01' anchorBgAlpha='01' showValues='0' showLegend='1' legendBorderAlpha='0' legendBgAlpha='0' legendPosition='Bottom' legendShadow='0' labelDisplay='Wrap' decimals='2' forceDecimals='1' exportEnabled='1' exportAtClient='1' exportHandler='fcExporter' exportFileName='15072011_LGPT2010Base235605_Chart' toolTipBgColor='FFFFFF'toolTipBorderColor='FFFFFF'><categories><category label='2011'/><category label='2012'/><category label='2013'/><category label='2014'/><category label='2015'/><category label='2016'/><category label='2017'/><category label='2018'/><category label='2019'/><category label='2020'/></categories><dataset seriesName='Net+benefit+expense++(IAS19+2008)' alpha='100' includeInLegend='1' color='5074D1' showValues='0' ><set value='-1966.42' tooltext='Net+benefit+expense++(IAS19+2008), -1966.42' link='j-SetClickedGraphDataId-ctl00_MainContent_hidClickedGraphDataStore,ctl00_MainContent_btnDrillDownHandler,0,0' /><set value='-2159.43' tooltext='Net+benefit+expense++(IAS19+2008), -2159.43' link='j-SetClickedGraphDataId-ctl00_MainContent_hidClickedGraphDataStore,ctl00_MainContent_btnDrillDownHandler,0,1' /><set value='-1099.64' tooltext='Net+benefit+expense++(IAS19+2008), -1099.64' link='j-SetClickedGraphDataId-ctl00_MainContent_hidClickedGraphDataStore,ctl00_MainContent_btnDrillDownHandler,0,2' /><set value='-1192.66' tooltext='Net+benefit+expense++(IAS19+2008), -1192.66' link='j-SetClickedGraphDataId-ctl00_MainContent_hidClickedGraphDataStore,ctl00_MainContent_btnDrillDownHandler,0,3' /><set value='-1296.61' tooltext='Net+benefit+expense++(IAS19+2008), -1296.61' link='j-SetClickedGraphDataId-ctl00_MainContent_hidClickedGraphDataStore,ctl00_MainContent_btnDrillDownHandler,0,4' /><set value='-1412.54' tooltext='Net+benefit+expense++(IAS19+2008), -1412.54' link='j-SetClickedGraphDataId-ctl00_MainContent_hidClickedGraphDataStore,ctl00_MainContent_btnDrillDownHandler,0,5' /><set value='-1541.56' tooltext='Net+benefit+expense++(IAS19+2008), -1541.56' link='j-SetClickedGraphDataId-ctl00_MainContent_hidClickedGraphDataStore,ctl00_MainContent_btnDrillDownHandler,0,6' /><set value='-1684.92' tooltext='Net+benefit+expense++(IAS19+2008), -1684.92' link='j-SetClickedGraphDataId-ctl00_MainContent_hidClickedGraphDataStore,ctl00_MainContent_btnDrillDownHandler,0,7' /><set value='-1843.95' tooltext='Net+benefit+expense++(IAS19+2008), -1843.95' link='j-SetClickedGraphDataId-ctl00_MainContent_hidClickedGraphDataStore,ctl00_MainContent_btnDrillDownHandler,0,8' /><set value='-2020.09' tooltext='Net+benefit+expense++(IAS19+2008), -2020.09' link='j-SetClickedGraphDataId-ctl00_MainContent_hidClickedGraphDataStore,ctl00_MainContent_btnDrillDownHandler,0,9' /></dataset><styles><definition><style name='myCaptionFont' type='font' font='Arial' size='16' color='000000' /><style name='myXAxisTitlesFont' type='font' font='Arial' size='13' color='000000' bold='0' /><style name='myYAxisTitlesFont' type='font' font='Arial' size='13' color='000000' bold='0' /><style name='myYAxisValuesFont' type='font' font='Arial' color='000000' bold='0' /><style name='myDataLabelsFont' type='font' font='Arial' color='000000' bold='0' /><style name='myDataValuesFont' type='font' font='Arial' color='000000' bold='0' /><style name='myToolTipFont' type='font' font='Arial' color='000000' bold='0' /></definition><application><apply toObject='CAPTION' styles='myCaptionFont' /><apply toObject='XAXISNAME' styles='myXAxisTitlesFont' /><apply toObject='YAXISNAME' styles='myYAxisTitlesFont' /><apply toObject='YAXISVALUES' styles='myYAxisValuesFont' /><apply toObject='DATALABELS' styles='myDataLabelsFont' /><apply toObject='DATAVALUES' styles='myDataValuesFont' /><apply toObject='TOOLTIP' styles='myToolTipFont' /></application></styles></chart>〈=EN&scaleMode=noScale&chartWidth=650&debugMode=0"> <param name="wMode" value="transparent"> <param name="allowScriptAccess" value="always"> <param name="quality" value="best"> <param name="scaleMode" value="noScale"> <embed src="/CustomControls/ResultsGraphPanel/Charts/MSColumn2D.swf" pluginspage="http://www.macromedia.com/go/getflashplayer" width="650" type="application/x-shockwave-flash" wMode="transparent" id="FusionChart_Chart" scaleMode="noScale" quality="best" flashvars="®isterWithJS=1&chartHeight=350&DOMId=FusionChart_Chart&dataXML=<chart animation='1' bgAlpha='0,0' showBorder='0' useRoundEdges='1' setAdaptiveYMin='1' numberScaleValue='1000,1000,1000' numberScaleUnit='K,M,B' caption='LGPT 2010 Base (23) 5%266 0.5' xAxisName='' yAxisName='' anchorAlpha='01' anchorBgAlpha='01' showValues='0' showLegend='1' legendBorderAlpha='0' legendBgAlpha='0' legendPosition='Bottom' legendShadow='0' labelDisplay='Wrap' decimals='2' forceDecimals='1' exportEnabled='1' exportAtClient='1' exportHandler='fcExporter' exportFileName='15072011_LGPT2010Base235605_Chart' toolTipBgColor='FFFFFF'toolTipBorderColor='FFFFFF'><categories><category label='2011'/><category label='2012'/><category label='2013'/><category label='2014'/><category label='2015'/><category label='2016'/><category label='2017'/><category label='2018'/><category label='2019'/><category label='2020'/></categories><dataset seriesName='Net+benefit+expense++(IAS19+2008)' alpha='100' includeInLegend='1' color='5074D1' showValues='0' ><set value='-1966.42' tooltext='Net+benefit+expense++(IAS19+2008), -1966.42' link='j-SetClickedGraphDataId-ctl00_MainContent_hidClickedGraphDataStore,ctl00_MainContent_btnDrillDownHandler,0,0' /><set value='-2159.43' tooltext='Net+benefit+expense++(IAS19+2008), -2159.43' link='j-SetClickedGraphDataId-ctl00_MainContent_hidClickedGraphDataStore,ctl00_MainContent_btnDrillDownHandler,0,1' /><set value='-1099.64' tooltext='Net+benefit+expense++(IAS19+2008), -1099.64' link='j-SetClickedGraphDataId-ctl00_MainContent_hidClickedGraphDataStore,ctl00_MainContent_btnDrillDownHandler,0,2' /><set value='-1192.66' tooltext='Net+benefit+expense++(IAS19+2008), -1192.66' link='j-SetClickedGraphDataId-ctl00_MainContent_hidClickedGraphDataStore,ctl00_MainContent_btnDrillDownHandler,0,3' /><set value='-1296.61' tooltext='Net+benefit+expense++(IAS19+2008), -1296.61' link='j-SetClickedGraphDataId-ctl00_MainContent_hidClickedGraphDataStore,ctl00_MainContent_btnDrillDownHandler,0,4' /><set value='-1412.54' tooltext='Net+benefit+expense++(IAS19+2008), -1412.54' link='j-SetClickedGraphDataId-ctl00_MainContent_hidClickedGraphDataStore,ctl00_MainContent_btnDrillDownHandler,0,5' /><set value='-1541.56' tooltext='Net+benefit+expense++(IAS19+2008), -1541.56' link='j-SetClickedGraphDataId-ctl00_MainContent_hidClickedGraphDataStore,ctl00_MainContent_btnDrillDownHandler,0,6' /><set value='-1684.92' tooltext='Net+benefit+expense++(IAS19+2008), -1684.92' link='j-SetClickedGraphDataId-ctl00_MainContent_hidClickedGraphDataStore,ctl00_MainContent_btnDrillDownHandler,0,7' /><set value='-1843.95' tooltext='Net+benefit+expense++(IAS19+2008), -1843.95' link='j-SetClickedGraphDataId-ctl00_MainContent_hidClickedGraphDataStore,ctl00_MainContent_btnDrillDownHandler,0,8' /><set value='-2020.09' tooltext='Net+benefit+expense++(IAS19+2008), -2020.09' link='j-SetClickedGraphDataId-ctl00_MainContent_hidClickedGraphDataStore,ctl00_MainContent_btnDrillDownHandler,0,9' /></dataset><styles><definition><style name='myCaptionFont' type='font' font='Arial' size='16' color='000000' /><style name='myXAxisTitlesFont' type='font' font='Arial' size='13' color='000000' bold='0' /><style name='myYAxisTitlesFont' type='font' font='Arial' size='13' color='000000' bold='0' /><style name='myYAxisValuesFont' type='font' font='Arial' color='000000' bold='0' /><style name='myDataLabelsFont' type='font' font='Arial' color='000000' bold='0' /><style name='myDataValuesFont' type='font' font='Arial' color='000000' bold='0' /><style name='myToolTipFont' type='font' font='Arial' color='000000' bold='0' /></definition><application><apply toObject='CAPTION' styles='myCaptionFont' /><apply toObject='XAXISNAME' styles='myXAxisTitlesFont' /><apply toObject='YAXISNAME' styles='myYAxisTitlesFont' /><apply toObject='YAXISVALUES' styles='myYAxisValuesFont' /><apply toObject='DATALABELS' styles='myDataLabelsFont' /><apply toObject='DATAVALUES' styles='myDataValuesFont' /><apply toObject='TOOLTIP' styles='myToolTipFont' /></application></styles></chart>〈=EN&scaleMode=noScale&chartWidth=650&debugMode=0" allowScriptAccess="always" height="350" /> </object> <!-- END Code Block for Chart FusionChart_Chart -->
If you need anything else, please shout.
Martin
Hi,
Thanks for your post.
If you are using renderChartHTML(), you would need to encode the special characters.
In case you are using renderChart(), you would not need to encode the special characters, provided you are using FusionCharts v 3.2.
If the problem persists, please send us a scaled down sample to look into the issue.
Awaiting for your response.
-
I have spent most of this afternoon trying to get my chart to show & and / in the legend text, and everytime I draw the chart, i cannot get it to display as I expect.
For the ampersand, as an example, I have a chart title which conatins an &, and also the legend text contains one too.
My solution was, prior to calling FusionCharts.RenderChartHTML, I do the following:
// if ampersand not added by code...
if (!xmlChartString.Contains("%25"))
{
   // replace ampersand with html character...
   xmlChartString = xmlChartString.Replace("%", "%25");
}

// if ampersand not added by code...
if (!xmlChartString.Contains("%26"))
{
   // replace ampersand with html character...
   xmlChartString = xmlChartString.Replace("&", "%26");
}
Example title text of 'Some text 5&6 Summer' displays correctly as 'Some text 5&6 Summer'
In the Xml that is rendered, the & has been converted to 5%266, which translates to 5&6 as expected.
Example series name text is 'P&L expense (New)', which displays in both the legend and the hover text as 'P%26L expense (New)'. The underlying xml is showing 'P%2526L+expense+(New)'.
I also have an example where my the series name text is 'Gains/losses', yet that displays as 'Gains%2flosses' in the legend and hover text, and 'Gains%252flosses' in the xml.
Can you tell me how I can ensure that the text is consistent in all aspects of the chart. This has become an urgent issue now and would be good to find a resolution quickly.
Many thanks
Martin
-
Hi Martin,
I am afraid, FusionCharts does not support this, as of now.

Thought there may also be another way to do it that I hadn't thought of, but never mind.
Thanks anyway
Martin
-
OK, I'll try and explain this as best I can.
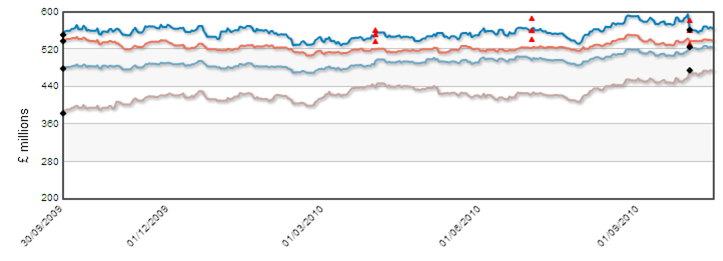
I have a line chart, and to this I have C# code which loops through adding series data based on data read from a variety of database tables. I also need to add a number of single data points at positions along the chart that are not linked to any of the existing lines. As a brief description of the chart, the x axis is an array of dates, and the y is values.
To add the single data points, I currently then add a single series for each point and add these to the series for the lines. Each series has only one data point, but the data point is highlighted as, say, a black triangle for each series. For this reason, these series can't be included in the legend, but I was wondering if it is possible to group a number of series into one, and show the group on the legend.
As you can see, I have two sets of series to add, one that shows as a black diamond, the other as a red triangle. I currently have the interactive legend working for the lines, but have added these red and black series as not included in the legend.
Is there a way to do what I want and group them?
Thanks
Martin
-
Can anyone help?

-
I have a stacked bar chart on my page, and if I use tab, it cycles through the controls on the page, and includes (but not always) each series in my stacked bars. Is it possible to exclude the chart object and/or series from the tab order?
Thanks
Martin
-
Thanks - I ran the uninstaller and re-installed it via the download manager, and all is OK now.
Thanks again
Martin
-
Hi
I'm still having problems with the charts printing small. I have installed the latest available version of Flash Player (10.1.102.64), and tried printing your print manager demo chart, as well as several others from your demos, and they all still print small. I am using IE7, though it does seem to be working perfectly in Firefox. The internal users at my company all have managed desktops, so upgrading it IE8 is not something I can do, as i have to keep the same version as the users.
Thanks
Martin
-
Hi Martin,
Please try setting the attribute "legendIconScale" to '.001' in the <chart> element to achieve what you intend to.
Hope this helps.
That's great. Many thanks.
-
Hi Martin,
You are always welcome.
I hope your issue is resolved.
Please feel free to revert in case you have any further queries.
Hi
I'm not sure I've explained my question very well.
I want to show a legend without a 'symbol' shown for each series, just the series name, but still keep the interactive element.
In my example, my three series (FTSE 100, FTSE250 and FTSE350) want to show as just text, and when clicked, the interactive element will still switch them on/off without the need for me to set the series colour.
I hope I have explained that better.
Martin
-
Thanks.
Will take a look and come back if I have any more questions.
Martin
-
Please try setting the attribute "interactiveLegend" to '0' in the <chart> element to disable this functionality.
This attribute lets you interact with the legend in your chart. When you click a legend key, the data-plots associated with that series are eliminated from the chart. Re-clicking the key causes the data-plots to reappear.
Yes, that's exactly what I was looking for - thanks.
Could you please specify this issue a bit elaborately? More preferably with a screenshot of your requirement.
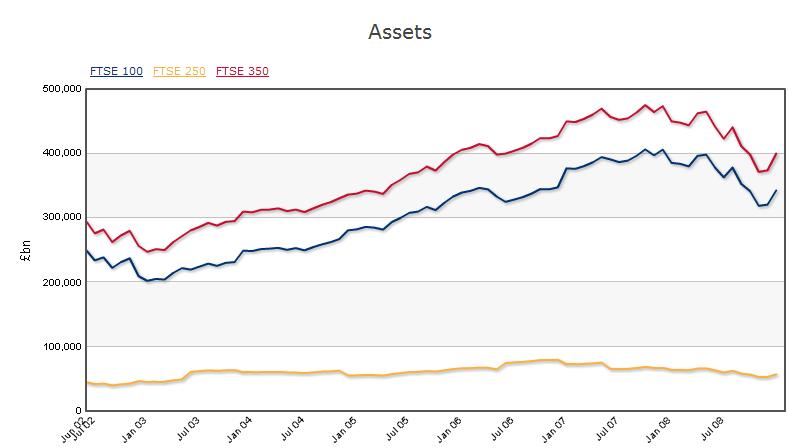
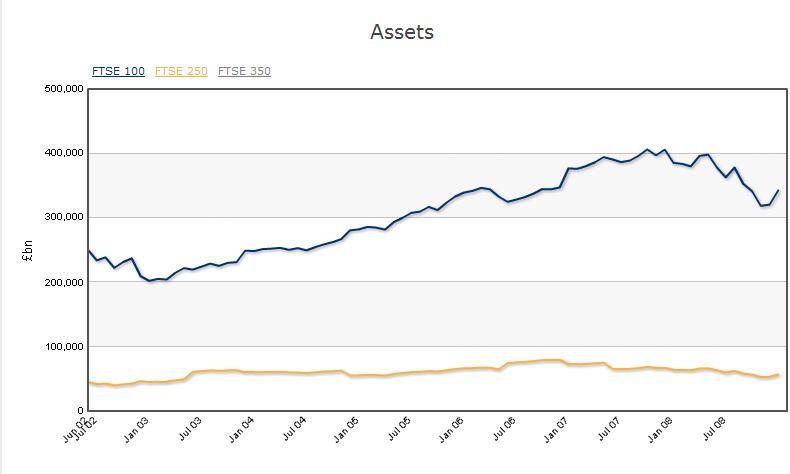
I have a line chart showing three series. The series names are FTSE100, FTSE250 and FTSE350. The series colours are blue, yellow and red respectively. I currently have it set up so that the legend label text is fed from the chart names, and by clicking on the label (which is a link button), it sets the visibility of the series to transparent, and sets the link button text to grey, to mimic being disabled. Clicking again does the opposite.
You can see a before and after image below.
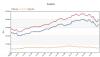
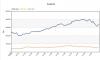
What I'd like is to use an interactive legend, but instead of a series identifier and text, just use text. I hope that makes sense?
If you need any further clarification, please let me know.
Martin
-
I have noticed in the latest release of the fusion library, each legend item is now shown with the series type, i.e. bars/columns/lines in the series colour to identify it, and if you click any legend item, it hides the series from view without the need to re-draw the chart.
As I understand, this used to be be something that had to be coded for using javascript in earlier releases, and so although it is a good addition, can it be switched off so that the user cannot hide series by simply clicking the legend item?
Also, can you use different indicators for the legend items? I have a line chart where I want specific text in the series colour as the legend item.
Thanks
Martin
-
Hi
Yes, that was my logic - they do not want the user to have to click a buton after 'Save as JPEG', only a save button on a Save As dialog.
This is a C# web application (.net 3.5), so apart from the calls to the js files, there is no other scripting language. I am using an AJAX updatepanel around the chart.
Thanks
Martin
Hi Martin,
Could you please confirm the following:-
1) Whether you wish your chart to save directly as image/PDF as soon as it renders on the browser page?
2) The name of the server-side scripting language, in case you are using one.
Awaiting your reply.
-
And even with the ExportReady removed, it now doesn't show the Waiting, but still does nothing.
Do I need to set anything else, say in the chart attributes, to show the dialog?
Thanks
Martin
Hi
No, sorry, doesn't seem to work. I just get 'waiting' after the image has been created.
This is the code I have in my page:
<script language="javascript" type="text/javascript">
       //This event is raised when the chart has finished capture phase and passed the data to
       //Export Component for further processing
       function FC_ExportReady(DOMId) {
           // create export object...
           var myExportComponent = new FusionChartsExportObject("fcExporter1", "FusionCharts/FCExporter.swf");
           // render the exporter SWF in dummy DIV...
           myExportComponent.Render("fcExportDiv");
       }

       function FC_Rendered(DOMId)
       {
           if (FusionCharts(DOMId).exportChart) {
               // you can change the value of exportFormat to 'PNG' or 'PDF'
               FusionCharts(DOMId).exportChart({ "exportFormat": 'JPG' });
           }
       }
   </script>
I right click on the chart and select 'Save as JPEG Image', it shows the Capturing data dialog, and at 100%, I get a greyed out 'waiting' area where I inserted my fcExportDiv div.
Thanks
Martin
-
Hi
No, sorry, doesn't seem to work. I just get 'waiting' after the image has been created.
This is the code I have in my page:
<script language="javascript" type="text/javascript">
       //This event is raised when the chart has finished capture phase and passed the data to
       //Export Component for further processing
       function FC_ExportReady(DOMId) {
           // create export object...
           var myExportComponent = new FusionChartsExportObject("fcExporter1", "FusionCharts/FCExporter.swf");
           // render the exporter SWF in dummy DIV...
           myExportComponent.Render("fcExportDiv");
       }

       function FC_Rendered(DOMId)
       {
           if (FusionCharts(DOMId).exportChart) {
               // you can change the value of exportFormat to 'PNG' or 'PDF'
               FusionCharts(DOMId).exportChart({ "exportFormat": 'JPG' });
           }
       }
   </script>
I right click on the chart and select 'Save as JPEG Image', it shows the Capturing data dialog, and at 100%, I get a greyed out 'waiting' area where I inserted my fcExportDiv div.
Thanks
Martin
Hi Martin,
Please try calling the export function on calling the FCRender() function.
Ref.- <script type="text/javascript">
function FC_Rendered(DOMId) {
if (FusionCharts(DOMId).exportChart) {
// you can change the value of exportFormat to 'PNG' or 'PDF'
FusionCharts(DOMId).exportChart({ "exportFormat": 'JPG' });
}
}
</script>
I hope this helps.
-
I have been asked to see if, after selecting one of the export options from the right-click menu, i.e. Save as JPG, Save as PNG etc... whether there is a way for it to automatically show a Save As dialog once the chart image has been generated?
The examples all seem to show a Save button or some sort of user interaction for this to work. If I right-click and Save as JPG, it captures data, then does nothing.
Thanks
Martin
-
Setting showBorder to 1 sets the chart object border NOT the chart area border, i.e. what shows as the axes for the chart.
-
It seems, by default, the chart area is bordered by a shadowed grey edge - when the chart is exported to an image, the border disappears.
I tried setting the showBorder to true, but this manages the border of the chart object - is it possible to either include the chart area border when exporting or to switch it on/control it so that it will be present in exported images?
Thanks
Martin
-
Hi
One quick question on this - the waterfall chart is no good for one particular chart required as it's a stacked chart that I am trying to display, so I have to continue to use the stacked column and display the tooltext even when the series is not visible.
As a work around, I tried setting the tooltext attribute for each datapoint to be string.empty, but that gets overridden with the default tooltext - surely if you set the tooltext attribute to anything (even an empty string) it should take that as the text to display? The only way it does seem to work is to set the text to ' ' (i.e. a single space), but when you hover, you get a small block where the empty space is displaying in the tooltext pop-up.
Can you confirm this is another limitation of the Fusion charts please.
Thanks
Martin
-
Thanks - I wasn't sure at first, but it does look like we can use that to achieve what we need - we have purchased the PowerCharts package as well, so that works out well.
I'll come back and ask a specific question about this chart type if I need more help.
Martin
-
Rajroop (5/13/2010)
Hey Martin,I'm afraid this is not possible, as of now. The 'tooltip' attribute may be disabled. However, it's has a global application(in the <chart> element) and not local i.e. at the <set> element level.
Hi
That's really disappointing
Is there any other way to produce a 'floating' column chart? I have used a stacked column, and set the visibility of the first few series to achieve a 'floating' column.
Thanks
Martin
-
I am trying to create a 'floating' stacked column chart, and to do this, have created a series which I set as not visible by setting the border and fill to alpha=0. Now, the problem is that the default tooltip text still displays when you hover over the empty space where the 'hidden' series is - why does this happen? Does the tooltip not take it's properties from the series, and therefore should be invisible too? Have tried setting the tooltext attribute to '' but still no joy.
The xml for the dataset tag is set to:
alpha='01' includeInLegend='0' anchorAlpha='01' anchorBgAlpha='01'
Any ideas or suggestions as to how to fix this?
Thanks
Martin
Html Characters In Legend And Hover Text
in XML Issue
Posted · Report reply
Thanks.
So are you saying that the approach I have taken is not the best one and I would be better using a different method? If so, I am a little confused as to how I should change my code to use RenderChart? I did try that, but it gave me different output, which I guess means that it will not work with a literal control? I'd like to know what changes I need to make to work with the RenderChart method?
Thanks again
Martin