
scav
-
Content count
4 -
Joined
-
Last visited
Posts posted by scav
-
-
Hello,
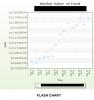
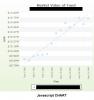
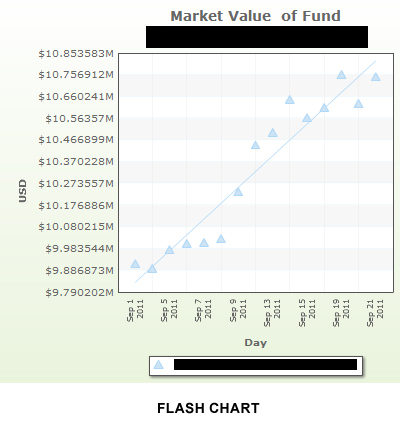
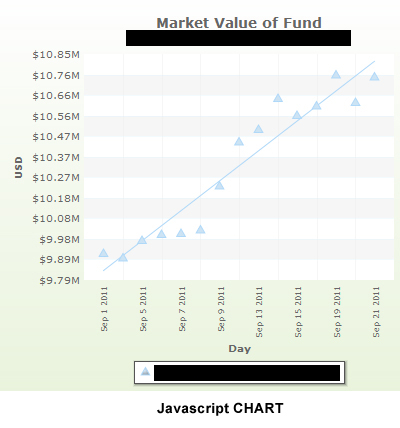
Not 100% sure if this is a bug, but when using scatter.swf, the labels on the y axis do not automatically round when displaying in flash. The values do append the "K" for thousand and the "M" for millions, but then display the whole number. This is not the case for when displaying the chart using javascript. I have attached examples of both and the xml
-
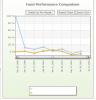
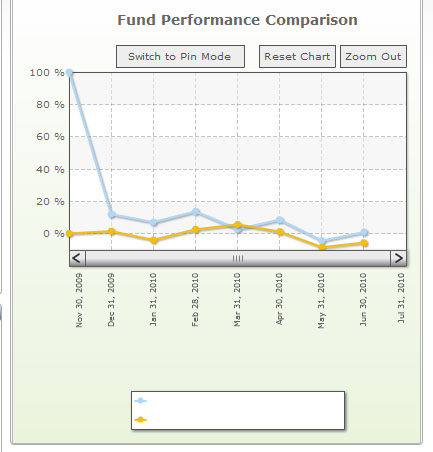
I am having an issue with the zoomline chart and using the shorthand xml where it will not display the last value on the right hand side in the chart. We are dynamically creating the xml content that feeds the chart and time and time again it is not displaying the final value. Can someone please help me in anyway they can? Here is an example of the xml on a small scale:
<?xml version="1.0" encoding="UTF-8"?>
<chart allowPinMode="1" bgColor="d4e8ba,fefefe" canvasBorderThickness="0" caption="Fund Performance Comparison" compactDataMode="1" dataSeparator="|" displayEndIndex="9" displayStartIndex="1" divLineAlpha="40" divLineIsDashed="1" dynamicAxis="1" enableIconMouseCursors="0" labelDisplay="Rotate" numberSuffix=" %" outCnvBaseFontColor="666666" rotateValues="1" vDivLineAlpha="40">
<categories>
Nov 30, 2009|Dec 31, 2009|Jan 31, 2010|Feb 28, 2010|Mar 31, 2010|Apr 30, 2010|May 31, 2010|Jun 30, 2010|Jul 31, 2010
</categories>
<dataset seriesName="Fake Fund, Ltd.">
99.99173141020358|12.247711572723397|7.26164776452598|13.952367101392294|2.9012105615070727|8.770394450215635|-4.074600642713633|1.1107948260828504|-2.2477792211587966
</dataset>
<dataset seriesName="Fake Index">
0.379298023802|1.77705977383|-3.6974262398|2.85136934638|5.87963675543|1.47593271936|-8.19759162039|-5.38823766993|6.87778327561
</dataset>
<styles>
<definition>
<style duration="1" name="myBgAnim" param="_alpha" start="0" type="Animation"/>
<style name="myLabelsFont" size="8" type="font"/>
<style bold="1" name="CaptionFont" size="14" type="FONT"/>
<style bgColor="ffffff" borderColor="2E4A89" name="ToolTipFont" type="FONT"/>
</definition>
<application>
<apply styles="myBgAnim" toObject="Background"/>
<apply styles="CaptionFont" toObject="CAPTION"/>
<apply styles="ToolTIpFont" toObject="TOOLTIP"/>
<apply styles="myLabelsFont" toObject="DataLabels"/>
</application>
</styles>
</chart>
-
Hello,
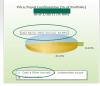
When using xml, you need to represent an "&" as "&" and the title and values in the legend get displayed normally. However, the rollover points or over sections of the pie charts, the pop-up displays the "&" value instead of the "&". Is there a fix or a work around for this issue?
Thanks
Scav

Y Axis Label Issue With Scatter.swf
in Bug Reports
Posted · Report reply
Hi Angshu,
Thank you for the help. I applied the change as you recommended and it resolved the issue, however now with graphs that show both positive and negative values it places the 0 in an awkward place. Is there an attribute to remove the zero?