
TheWitness
-
Content count
29 -
Joined
-
Last visited
Posts posted by TheWitness
-
-
After refreshing a chart by using a dispose() method followed by redefining and recreating the fusionchart I'm getting the following warning when hovering or moving the cursor over the 'updated' chart.:
Uncaught TypeError: this._env is undefined
This is on line 13 of fusioncharts.js
This is for version 3.15.2.
Seems that the function is falsely assuming that the value exists. So, there are no bounds checking going on.
-
Okay, figured it out. I not only had to clone the chart, but insert the data:
<snip>
var newPanel = charts[panel].clone();
var chart_xml = charts[panel].originalDataSource;
newPanel.setXMLData(chart_xml);
newPanel.render('fullscreen')
newPanel.resizeTo(width, height);
<snip> -
Ayan,
Just getting back to this now. I think I see the problem. The chart that was properly cloned (I guess), but the "originalDataSource" value is set to undefined. On the original chart, the originalDataSource was populated via a callback with XML data. Do I have to grab the data again via a callback, or is there a way to clone that data as well?
Larry
-
How can I do that using the 3.1.5.2? I don't see a way to include that version of the library.
-
I did multiple things Ayan and nothing worked.
The big change that I did was label the object using the following:
FusionCharts({
id: 'chart_pane_id',
...
});As soon as I name the ID of the object using that call, the clone basically starts complaining that it can not find data and says no data to display even though when I use the debugger, the parent dom object has the right ID and the FusionCharts(chart_panel_id) returns object as expected. The clone simply fails, the resize just fails.
Could it be that the use of the JSON tag "id" though it works, is not supported?
By the way, I was able to clone the SVG using jQuery just fine and insert it, but then I lost the ability to resize
 Basically:
var chartObject = $('#chart_panel_id')
$(''#fullscreen').html(chartObject); -
That's what I used as the model for the clone() in the first place, and thanks for that. It was working prior to the update to 3.15.2. Let me have a look though. Before I was searching the DOM for the chart object, and I did not assign and "id" in the "new FusionCharts({})" call of the parent object. So, there were other changes. But it's presently close to the jsfiddle example.
-
I've just recently upgrade from 3.11.x to 3.15.2 and it solved a "massive" memory leak, so thanks. However, when I try to clone() a chart now, either by the charts Id or through it's variable name, it's coming back with no data to display. Code looks something like this:
<snip>
if (FusionCharts(chartid)) {
//var newPanel = FusionCharts(chartid).clone();
var newPanel = charts[panel].clone();
newPanel.render('fullscreen')
newPanel.resizeTo(width, height);
}<snip>
The array charts[panel] holds the chart object, but you can see the line above the clode, which was the way I was cloning it before upgrading. Tried both way and nada.
Thanks,
TheWitness
-
That is correct. We will offline calculate the various data points (min, max, median, average, 1-quartile, 3-quartile, etc.) in a daily ETL process. That way the UI can be very responsive to all subsequent user requests. The data will go from tens of millions of records per day, to tens of thousands of pre-calculated records per day, and for the specific graphing function, dozens of records.
-
I will contact the sales organization to log a feature request. It is not practical to pass millions of data points over httpd.
-
You have no idea how disappointed I am. Since we are under support, is it possible to modify the source to allow us to modify the behavoir? This chart is exactly what we need, but our record set's are just too large to be passing over a httpd connection. Without being able to pass the calculated values directly, this chart becomes USELESS... Sadly. So, modification of source is what we would need to do....
-
If I want to create a Box and Whisker chart, but each dataset contains millions of rows, is there a way I can send the final data (median, max, min, +-3std deviation) to the chrart instead of the entire set for dataset? I think sending a million rows for dataset, that rendering will be extreemly slow.
Please advise.
Larry Adams
-
Yea, this and a series that contains all NULL data both appear to be a bugs IMHO.
-
Sorry, did not hit the attach button....
-
In addition, it appears that for the null data correction, it will not start the data until at least one non-null datapoint is found. Please review the chart attached.
-
The resolved the gaps, but if a data set has all zero for one series, then it will not appear at all on the chart. This is not as significant as the prior issue, but is there a way to resolve that? Right now, the legend and the data points are all missing from the graph under this condition.
Thanks!
-
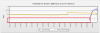
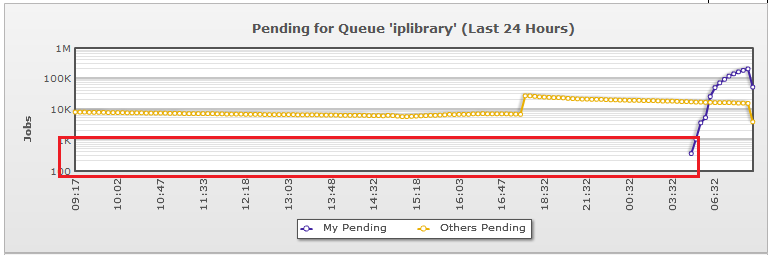
When you render a Logarithmic line that includes values of '0', the graphs do not render continuously. I will attach XML and image. This is with the latest 5/28/2013 release.
<chart caption='Finished for Queue 'blah' in Project 'blah' (Last 24 Hours)' yAxisName='Jobs' showAnchors='1' anchorRadius='2' formatNumberScale='1' decimalPrecision='3' showValues='0' showNames='1' axis='log' logBase='10' showLegend='1' animation='1' showhovercap='1' labelStep='9'><categories>
<category label='09:32' />
<category label='09:37' />
<category label='09:42' />
<category label='09:47' />
<category label='09:52' />
<category label='09:57' />
<category label='10:02' />
<category label='10:07' />
<category label='10:12' />
<category label='10:18' />
<category label='10:22' />
<category label='10:28' />
<category label='10:33' />
<category label='10:38' />
<category label='10:43' />
<category label='10:48' />
<category label='10:53' />
<category label='10:58' />
<category label='11:03' />
<category label='11:08' />
<category label='11:13' />
<category label='11:18' />
<category label='11:22' />
<category label='11:28' />
<category label='11:32' />
<category label='11:37' />
<category label='11:42' />
<category label='11:47' />
<category label='11:52' />
<category label='11:58' />
<category label='12:02' />
<category label='12:07' />
<category label='12:12' />
<category label='12:18' />
<category label='12:22' />
<category label='12:30' />
<category label='12:33' />
<category label='12:37' />
<category label='12:42' />
<category label='12:47' />
<category label='12:52' />
<category label='12:57' />
<category label='13:02' />
<category label='13:07' />
<category label='13:12' />
<category label='13:17' />
<category label='13:22' />
<category label='13:27' />
<category label='13:32' />
<category label='13:37' />
<category label='13:42' />
<category label='13:47' />
<category label='13:52' />
<category label='13:57' />
<category label='14:02' />
<category label='14:08' />
<category label='14:12' />
<category label='14:17' />
<category label='14:22' />
<category label='14:27' />
<category label='14:32' />
<category label='14:37' />
<category label='14:42' />
<category label='14:47' />
<category label='14:52' />
<category label='14:57' />
<category label='15:02' />
<category label='15:07' />
<category label='15:12' />
<category label='15:17' />
<category label='15:22' />
<category label='15:27' />
<category label='15:32' />
<category label='15:37' />
<category label='15:42' />
<category label='15:47' />
<category label='15:52' />
<category label='15:57' />
<category label='16:02' />
<category label='16:07' />
<category label='16:12' />
<category label='16:17' />
<category label='16:22' />
<category label='16:27' />
<category label='16:32' />
<category label='16:37' />
<category label='16:42' />
<category label='16:47' />
<category label='16:53' />
<category label='16:57' />
<category label='17:02' />
<category label='17:07' />
<category label='17:12' />
<category label='17:32' />
<category label='17:52' />
<category label='18:12' />
<category label='18:32' />
<category label='18:52' />
<category label='19:12' />
<category label='19:32' />
<category label='19:52' />
<category label='20:12' />
<category label='20:32' />
<category label='20:52' />
<category label='21:27' />
<category label='21:32' />
<category label='21:52' />
<category label='22:12' />
<category label='22:32' />
<category label='22:52' />
<category label='23:12' />
<category label='23:32' />
<category label='23:52' />
<category label='00:12' />
<category label='00:33' />
<category label='00:52' />
<category label='01:12' />
<category label='01:33' />
<category label='01:53' />
<category label='02:12' />
<category label='02:32' />
<category label='02:52' />
<category label='03:12' />
<category label='03:32' />
<category label='03:53' />
<category label='04:13' />
<category label='04:32' />
<category label='04:52' />
<category label='05:12' />
<category label='05:32' />
<category label='05:52' />
<category label='06:12' />
<category label='06:32' />
<category label='06:52' />
<category label='07:12' />
<category label='07:32' />
<category label='07:52' />
<category label='08:12' />
<category label='08:32' />
<category label='08:52' />
<category label='09:12' />
</categories>
<dataset seriesName='My Done' color='7EE600' anchorBorderColor='7EE600'>
<set value='0' />
<set value='0' />
<set value='0' />
<set value='0' />
<set value='0' />
<set value='0' />
<set value='0' />
<set value='0' />
<set value='0' />
<set value='0' />
<set value='0' />
<set value='0' />
<set value='0' />
<set value='0' />
<set value='0' />
<set value='0' />
<set value='0' />
<set value='0' />
<set value='0' />
<set value='0' />
<set value='0' />
<set value='0' />
<set value='0' />
<set value='0' />
<set value='0' />
<set value='0' />
<set value='0' />
<set value='0' />
<set value='0' />
<set value='0' />
<set value='0' />
<set value='0' />
<set value='0' />
<set value='0' />
<set value='0' />
<set value='0' />
<set value='0' />
<set value='0' />
<set value='0' />
<set value='0' />
<set value='0' />
<set value='0' />
<set value='0' />
<set value='0' />
<set value='0' />
<set value='0' />
<set value='0' />
<set value='0' />
<set value='0' />
<set value='0' />
<set value='0' />
<set value='0' />
<set value='0' />
<set value='0' />
<set value='0' />
<set value='0' />
<set value='0' />
<set value='0' />
<set value='0' />
<set value='0' />
<set value='0' />
<set value='0' />
<set value='0' />
<set value='0' />
<set value='0' />
<set value='0' />
<set value='0' />
<set value='0' />
<set value='0' />
<set value='0' />
<set value='0' />
<set value='0' />
<set value='0' />
<set value='0' />
<set value='0' />
<set value='0' />
<set value='0' />
<set value='0' />
<set value='0' />
<set value='0' />
<set value='0' />
<set value='0' />
<set value='0' />
<set value='0' />
<set value='0' />
<set value='0' />
<set value='0' />
<set value='0' />
<set value='0' />
<set value='0' />
<set value='0' />
<set value='0' />
<set value='0' />
<set value='0' />
<set value='0' />
<set value='0' />
<set value='0' />
<set value='0' />
<set value='0' />
<set value='0' />
<set value='0' />
<set value='0' />
<set value='0' />
<set value='0' />
<set value='0' />
<set value='0' />
<set value='0' />
<set value='0' />
<set value='0' />
<set value='1' />
<set value='1' />
<set value='0' />
<set value='3' />
<set value='0' />
<set value='0' />
<set value='0' />
<set value='0' />
<set value='0' />
<set value='0' />
<set value='0' />
<set value='0' />
<set value='0' />
<set value='0' />
<set value='0' />
<set value='0' />
<set value='0' />
<set value='0' />
<set value='2' />
<set value='4414' />
<set value='497' />
<set value='319' />
<set value='150' />
<set value='68' />
<set value='78' />
<set value='118' />
<set value='141' />
<set value='207' />
<set value='105' />
<set value='150' />
<set value='109' />
<set value='79' />
</dataset>
<dataset seriesName='Others Done' color='942D0C' anchorBorderColor='942D0C'>
<set value='48' />
<set value='116' />
<set value='407' />
<set value='43' />
<set value='69' />
<set value='16' />
<set value='0' />
<set value='19' />
<set value='100' />
<set value='16' />
<set value='2' />
<set value='23' />
<set value='0' />
<set value='24' />
<set value='0' />
<set value='62' />
<set value='0' />
<set value='39' />
<set value='0' />
<set value='31' />
<set value='0' />
<set value='21' />
<set value='0' />
<set value='620' />
<set value='0' />
<set value='57' />
<set value='0' />
<set value='120' />
<set value='0' />
<set value='65' />
<set value='0' />
<set value='31' />
<set value='0' />
<set value='854' />
<set value='934' />
<set value='236' />
<set value='127' />
<set value='191' />
<set value='18' />
<set value='0' />
<set value='165' />
<set value='0' />
<set value='58' />
<set value='89' />
<set value='16' />
<set value='0' />
<set value='32' />
<set value='112' />
<set value='38' />
<set value='85' />
<set value='56' />
<set value='8' />
<set value='0' />
<set value='45' />
<set value='81' />
<set value='57' />
<set value='20' />
<set value='96' />
<set value='16' />
<set value='60' />
<set value='76' />
<set value='53' />
<set value='94' />
<set value='59' />
<set value='43' />
<set value='10' />
<set value='18' />
<set value='47' />
<set value='63' />
<set value='46' />
<set value='22' />
<set value='19' />
<set value='42' />
<set value='41' />
<set value='62' />
<set value='60' />
<set value='70' />
<set value='31' />
<set value='62' />
<set value='67' />
<set value='93' />
<set value='79' />
<set value='81' />
<set value='53' />
<set value='98' />
<set value='62' />
<set value='85' />
<set value='66' />
<set value='131' />
<set value='92' />
<set value='43' />
<set value='115' />
<set value='132' />
<set value='123' />
<set value='114' />
<set value='100' />
<set value='84' />
<set value='43' />
<set value='1629' />
<set value='3885' />
<set value='1281' />
<set value='1029' />
<set value='594' />
<set value='230' />
<set value='530' />
<set value='356' />
<set value='2157' />
<set value='248' />
<set value='402' />
<set value='688' />
<set value='2063' />
<set value='1431' />
<set value='7925' />
<set value='2888' />
<set value='669' />
<set value='623' />
<set value='378' />
<set value='122' />
<set value='72' />
<set value='30' />
<set value='926' />
<set value='325' />
<set value='197' />
<set value='1253' />
<set value='2201' />
<set value='2270' />
<set value='529' />
<set value='126' />
<set value='1229' />
<set value='139' />
<set value='233' />
<set value='2211' />
<set value='160' />
<set value='122' />
<set value='198' />
<set value='414' />
<set value='215' />
<set value='920' />
<set value='163' />
<set value='148' />
<set value='206' />
</dataset>
</chart>
-
Is it that the Gantt chart is patented, or the method of procedure using JavaScript? If its the later, that's quite lame.
TheWitness
1345525421[/url]' post='48673']Hi,
Welcome to the FusionCharts Forum

Thank you for the post.
I am afraid, we do not support JavaScript version of Gantt chart.
Though we are capable of developing one, we are unable to develop it, as it is patented by one of the companies.
And may I use the fusion widgets in my web page with the trial version?
>> Trial version is meant for evaluation purpose only.
The evaluation version comes with a FusionCharts watermark on each of the charts.
If you want to get the watermarks removed, you may buy our product.
Please refer to the link below for more details on the 'FusionCharts Suite XT Licensing and Pricing',
http://www.fusioncharts.com/buy/
Hope this helps!
-
Hello Fusion Developers and Users. I have been using FusionCharts for a few years now, and there are a few Chart Types that are desirable, that do not exist currently. My experience comes from RRDtool, which although powerful for what it does, does not provide the variety of graph types.
First of all, missing chart type:
Multi-Series 2/3D Area with Stack and Line
Presently, you can create an Area Graph with Lines (and/or columns), but you can not Stack the Areas and include Lines at the Same time. In RRDtool, this is quite a common fair. If I am to emulate an RRDtool Graph, I need to have this functionality.
Also, another 'major' issue is Canvas ordering. Presently, the order of the Canvas is not respected. For example, if I use the Multi-Series Combination (Column, Area, Line) Chart, there is no way that I can place the Area (or Stack) at the back of the Canvas. It's always in front of the Columns. That's quite Ugly. In RRDtool, the Canvas is layered from back to front, and from the first to last items graph command (aka XML).
This is a somewhat fundamental concept that seems to be missing, at lest from this important Chart Type.
TheWitness
-
Hi,
Welcome to FusionCharts Forum!

Could you please send us a scaled down sample to look into the issue?
Please confirm the FusionCharts version you are using.
Awaiting for your response.
He is using XT. The issue is that when you refresh the page, the data 'may' be new, so, he should in fact regenerate the saved image after a page refresh as you can not be certain what has changed between refreshes. Therefore, the code currently uses jQuery to empty() the contents of the export <div> that held the export button and destroys the FusionCharts export object, as the refresh may have included a whole new Graph and without emptying the <div> and destroying the object, you could get an old graphic if the 'Save' button were pressed without first using the context menu to 'Create' a new image.
My question, as we worked on this together is, why is the save operation so slow? If I were using a GD library, in PHP for example, it should/would take milliseconds to render such an image. In either case, enjoying FusionCharts!
TheWitness
-
Hi Ryan,
Welcome to FusionCharts forum.
Please refer to the links below for the detailed information on the same:-
Ref.- http://www.fusioncharts.com/free/docs/Contents/Adv_Number_Basics.html
Hope this helps.
This response does not address the issue of Scientific Notation at all. I ran into this yesterday as well, and was able to 'avoid' the issue by using the PHP 'round()' function, but it looks as if this 'fundamental' mathematical concept is not supported. Please open a bug.
Thanks,
TheWitness
-
We are building a web application that requires that the entire Context Menu be replaced with each Objects Methods. We have full OEM license, and would rather advertise FusionCharts in other ways. How can we COMPLETELY replace the default Context Menu with the Object's available Methods?
Context Menu Picks would include things like:
Enable
Disable
Force Run
Suspend
Resume
Force Kill
Kill
Delete
Duplicate
Properties
Regards,
TheWitness
-
If I move the object on the page, I now get a different error.
#06091847 chartobject-1 Warning >> A FusionChart oject with the specified id "chartContainerportlet_7_3_10" already exists. Renaming it to chartobject-1
So, that much is better. I'm wondering what is going wrong and if it's a method issues. Here is the process I use when I build the page.
1) Create empty <div> for each chart object. Generate a uniqueue ID for that div.
2) Register the javascript for the chart object including the call back and rendering code. Do this as part or not a part of $().ready() {});
3) Error's appear for whatever reason indicating the id is already in use.
TheWitness
-
No joy...
#05102109  chartContainerportlet_6_1_5.render() Error >> A duplicate object  already exists with the specific Id: chartContainerportlet_6_1_5
#05102109  chartContainerportlet_7_3_10.render() Error >> A duplicate object  already exists with the specific Id: chartContainerportlet_7_3_10
-
Just confirming, this is what I have...
/*!
* FusionCharts JavaScript Library
* Copyright FusionCharts Technologies LLP
* License Information at <http://www.fusioncharts.com/license>
*
* @author FusionCharts Technologies LLP
* @version fusioncharts/3.2.1.release.2157
*
* Third-party attributions:
* SWFObject v2.2 <http://code.google.com/p/swfobject/>
* JSON v2 <http://www.JSON.org/js.html>
* Firebug Lite 1.3.0 <http://getfirebug.com/firebuglite>
* jQuery 1.4.2 <http://jquery.com/>
*/
TheWitness

Receiving Warnings When Hovering with Version 3.15.2
in General usage
Posted · Report reply
Let me get a copy and see what happens. Will keep you posted.