
Flexvision
-
Content count
11 -
Joined
-
Last visited
Posts posted by Flexvision
-
-
Hello, good evening! I need a little help.I'm trying to use bold in Pie3D values but I have failure. I read the documentation and it recommend to use styles, I follow the examples, copy and paste and can't use styles on pie. This feature is enable in in Pie3D?My chart XML, if you see, I try to use many types of "toObject" but none of this works, I try to use only one option at time and doesnt work.<chart bgColor='E0E0E0' bgAlpha='100' canvasBgAlpha='100' canvasBgColor='E0E0E0' showValues='1' showPercentValues='1' showBorder='0' howLabels='0' showLegend='0' slicingDistance='75' startingAngle='180' legendPosition='RIGHT' chartLeftMargin='0' chartRightMargin='0' chartTopMargin='0' chartBottomMargin='0' captionPadding='0' valuePadding='0' manageLabelOverflow='1' animation='0' enableSmartLabels='1' bold='1' > <set label='Migradas' value='30' color='00CC00' toolText='Migradas' isSliced='1' /> <set label='Pendentes' value='70' color='FF4D4D' toolText='Pendentes' /> <styles> <definition> <style name='myValuesFont' type='font' size='15' color='FFFFFF' bold='1' bgColor='666666' borderColor='666666'/> </definition> <application> <apply toObject='DataValues' styles='myValuesFont' /> <apply toObject='DataPlot' styles='myValuesFont' /> <apply toObject='Caption' styles='myValuesFont' /> <apply toObject='Canvas' styles='myValuesFont' /> <apply toObject='Value' styles='myValuesFont' /> <apply toObject='Legend' styles='myValuesFont' /> </application> </styles> </chart>This values don't respect my styles.

Thank you -
Hi,
Could you please send us a sample so that we are able to replicate the issue at our end?
Also, please provide the environment details where this can be replicate.
Awaiting your reply.
Yes, I can!
I need an email to send the project, the size is above 1 mb and you can make your tests.
I can't post here because is a project from my company.
Thanks!
-
Hi,
It seems, the disposing of chart instances is not being done properly before creating the new chart instance while refreshing the page.
So, could you please confirm, whether you are using unique chart IDs for all the charts/gauges in your page and disposing all the chart object instances while refreshing the page using your "refreshGraph()" method?
Awaiting your response!
Hello Sashibhusan, thanks for help me.
I use a unique ID to each chart, but isn't the problem, I tried to remove the lines $("#" + idGraph).hide() and $("#" + idGraph).remove() and work! I don't know what happen but the IE have some problem with this JS funcion.
After remove this lines the memory usage grows to 200 mb for example and stay stable in this number. To other brownser the use of hide and remove is indiferent, the memory usage are good.
Thanks for all!
-
Hello!
I have a Dashboard running in PHP with 12 charts, 9 Angular Gauge and 3 MsLine.
It's a simple PHP with divs to render the charts, in javascript I use the funcion setInterval to refresh the information of every 5 minutes. This function refresh the chart by the function setXMLUrl.
After o short time IE8 crash and need to close and open to works again. I monitored the memory during this refreshs and it grows to much every refresh.
My JSFunction to refresh:
function refreshGraph(tpGraph, idGraph, divRender, url){

var chart = FusionCharts( idGraph );
if( chart != null ) {
	$("#" + idGraph).hide();
	$("#" + idGraph).remove();

	chart.dispose();
	chart = null;
}

chart = new FusionCharts(tpGraph, idGraph, "100%", "100%", "0", "1");
chart.setTransparent(true);
chart.setXMLUrl(escape(url));
chart.render(divRender);
}
Sorry for my english, but somebody can help me, please?
Unfortunatelly I need to use the IE8, i can't change to Chrome, FF or other brownser.
Thanks
-
Thanks for your fast reply!
I think it could be a great suggestion for a new upgrade...
Best Regards,
Weider Lima
Hi,
Welcome to FusionCharts Forum!

I am afraid, FusionCharts does not support adjusting the tool tip size of maps, at this time.

Thank you very much for your continued patience and patronage.
Hope you have a great day!
-
Hi,
I´d like so much to adjust the tool-tip size of my Map. I want it have an exact size as 200px.
Here bellow, my cod:
<markers>
<definition>
<marker id='Alert5' x='300' y='400' label='Test' labelPos='bottom'/>
</definition>
<application>
<marker id='Alert5' shapeId='circle' toolText='Position 5'/>
</application>
</markers>
I´ll be greatfull for any help..
Best Regards,
Weider Lima
-
Hi,
Could you please send us the XML code to test it from our end?
Awaiting for your response.
Hi Angshu! Thank for your help.
Attached is XML:
<Chart bgColor='000000' bgAlpha='0' upperLimit='".$thresholds["limite"]."' lowerLimit='0' baseFontColor='FFFFFF' toolTipBorderColor='333333' toolTipBgColor='ffffff' gaugeOuterRadius='100' gaugeOriginX='150' gaugeOriginY='150' gaugeStartAngle='180' gaugeEndAngle='-90' placeValuesInside='0' gaugeInnerRadius='94%25' annRenderDelay='0' gaugeFillMix='' pivotRadius='0' showShadow='0' showBorder='0' autoScale='1' origW='300' origH='300' baseFontSize='20' showToolTip='0' majorTMColor='ffffff' majorTMAlpha='100' majorTMHeight='6' majorTMThickness='1' minorTMColor='ffffff' minorTMAlpha='100' minorTMHeight='6' minorTMThickness='1' showTickValues='0' showGaugeBorder='1' gaugeBorderColor='ffffff' gaugeBorderThickness='1' gaugeBorderAlpha='100' tickValueDistance='5' decimalPrecision='0'>

					   <dials>
							<dial id='valorFinal' value=\"1185000\" borderAlpha=\"0\" bgColor=\"990000\" baseWidth=\"1\" topWidth=\"1\" radius=\"100\" showValue='1' valueY='100'/>
							<dial id='picoDia' value=\"778000\" borderAlpha=\"0\" bgColor=\"990000\" baseWidth=\"0\" topWidth=\"0\" radius=\"100\" showValue='1' valueX='105' valueY='180'/>
							<dial id='picoHora' value=\"718544\" borderAlpha=\"0\" bgColor=\"990000\" baseWidth=\"0\" topWidth=\"0\" radius=\"100\" showValue='1' valueX='198' valueY='180'/>
						</dials>
			  		<alerts>
					<alert minValue='0'  maxValue='".$thresholds["minimo"]."' action='SHOWANNOTATION'  param=\"statusGreen\"/>
					<alert minValue='".$thresholds["minimo"]."'  maxValue='".$thresholds["maximo"]."' action='SHOWANNOTATION'  param=\"statusYellow\"/>
					<alert minValue='".$thresholds["maximo"]."'  maxValue='".$thresholds["limite"]."' action='SHOWANNOTATION'  param=\"statusRed\"/>
				</alerts>
				<colorRange>
					<color minValue='0' maxValue='".$thresholds["minimo"]."' code='009244' alpha='100'/>
					<color minValue='".$thresholds["minimo"]."'  maxValue='".$thresholds["maximo"]."' code='ffcb06' alpha='100'/>
					<color minValue='".$thresholds["maximo"]."'  maxValue='".$thresholds["limite"]."' code='d62327' alpha='100'/>
				</colorRange>
						<styles>
			  			<definition>
			        			<style name='MyFirstFontStyle' type='font' face='Arial' color='FFFFFF' bold='1' />
			        			<style name='MyFirstShadow' type='Shadow' color='000000' />
								<style name='TipStyle' type='font' font='Arial' size='14' color='333333' />
			  			</definition>
			  			<application>
			        			<apply toObject='value' styles='MyFirstFontStyle,MyFirstShadow' />
								<apply toObject='tooltip' styles='TipStyle' />
								<apply toObject='teste' styles='MyFirstFontStyle,MyFirstShadow' />
			  	  		</application>
				  		</styles>
						<annotations>
							<annotationGroup xPos='150' yPos='150' showBelow='1' origW='300' origH='300' autoScale='1' scaleText='1' visible='1'>
								<annotation type='circle' xPos='0' yPos='0' radius='130' startAngle='0' endAngle='360' fillColor='CCCCCC,555555'  fillPattern='linear' fillAlpha='100,100'  fillRatio='50,50' fillAngle='-45'/>
								<annotation type='circle' xPos='0' yPos='0' radius='125' startAngle='0' endAngle='360' fillColor='555555,cccccc'  fillPattern='linear' fillAlpha='100,100'  fillRatio='50,50' fillAngle='-45'/>
								<annotation type='circle' xPos='0' yPos='0' radius='120' startAngle='0' endAngle='360' fillColor='222222,000000'  fillPattern='linear' fillAlpha='100,100'  fillRatio='30,70' fillAngle='-90'/>
								<annotation type='circle' xPos='0' yPos='0' radius='110' startAngle='0' endAngle='360' fillColor='0d8b44,98c93c'  fillPattern='linear' fillAngle='270' fillRatio='50,50'/>
								<annotation type=\"circle\" xPos=\"0\" yPos=\"0\" radius=\"110\" fillPattern=\"radial\" fillColor=\"000000,000000\" fillAlpha=\"0,90\" fillRatio=\"60,40\" fillAngle=\"270\"/>
								<annotation type=\"circle\" xPos=\"0\" yPos=\"-16\" radius=\"90\" fillPattern=\"linear\" fillColor=\"000000,ffffff\" fillAlpha=\"15,0\" fillRatio=\"50,50\" fillAngle=\"270\"/>
								<annotation type='circle' xPos='0' yPos='0' radius='110' startAngle='355' endAngle='185' fillColor='000000' fillAngle='270' fillAlpha='40' fillRatio='50'/>
								<annotation type='line' xPos='0' yPos='10' toYPos='70' color='acc396' thickness='1'/>
								<annotation type='text' label='".$dados["label"]."' font='Arial' xPos='0' yPos='-25' align='center' fontcolor='FFFFFF' fontSize='14' isBold='1'/>
								<annotation type='text' label='' font='Arial' xPos='-7' yPos='45' align='right' vAlign='left' fontcolor='FFFFFF' fontSize='12' isBold='1'/>
								<annotation type='text' label='' font='Arial' xPos='7' yPos='45' align='left' vAlign='left' fontcolor='FFFFFF' fontSize='12' isBold='1'/>
							</annotationGroup>
							<annotationGroup xPos='150' yPos='150' showBelow='1' origW='300' origH='300' autoScale='1' scaleText='1' id='statusRed' visible='0'>
								<annotation type='circle' xPos='0' yPos='0' radius='130' startAngle='0' endAngle='360' fillColor='CCCCCC,555555'  fillPattern='linear' fillAlpha='100,100'  fillRatio='50,50' fillAngle='-45'/>
								<annotation type='circle' xPos='0' yPos='0' radius='125' startAngle='0' endAngle='360' fillColor='555555,cccccc'  fillPattern='linear' fillAlpha='100,100'  fillRatio='50,50' fillAngle='-45'/>
								<annotation type='circle' xPos='0' yPos='0' radius='120' startAngle='0' endAngle='360' fillColor='222222,000000'  fillPattern='linear' fillAlpha='100,100'  fillRatio='30,70' fillAngle='-90'/>
								<annotation type='circle' xPos='0' yPos='0' radius='110' startAngle='0' endAngle='360' fillColor='ef4937,860a0c'  fillPattern='linear' fillAngle='270' fillRatio='50,50'/>
								<annotation type=\"circle\" xPos=\"0\" yPos=\"0\" radius=\"110\" fillPattern=\"radial\" fillColor=\"000000,000000\" fillAlpha=\"0,90\" fillRatio=\"60,40\" fillAngle=\"270\"/>
								<annotation type=\"circle\" xPos=\"0\" yPos=\"-16\" radius=\"90\" fillPattern=\"linear\" fillColor=\"000000,ffffff\" fillAlpha=\"15,0\" fillRatio=\"50,50\" fillAngle=\"270\"/>
								<annotation type='circle' xPos='0' yPos='0' radius='110' startAngle='355' endAngle='185' fillColor='000000' fillAngle='270' fillAlpha='40' fillRatio='50'/>
								<annotation type='line' xPos='0' yPos='10' toYPos='70' color='acc396' thickness='1'/>
								<annotation type='text' label='".$dados["label"]."' font='Arial' xPos='0' yPos='-25' align='center' fontcolor='FFFFFF' fontSize='14' isBold='1'/>
								<annotation type='text' label='' font='Arial' xPos='-7' yPos='45' align='right' vAlign='left' fontcolor='FFFFFF' fontSize='12' isBold='1'/>
								<annotation type='text' label='' font='Arial' xPos='7' yPos='45' align='left' vAlign='left' fontcolor='FFFFFF' fontSize='12' isBold='1'/>
							<annotationGroup xPos='150' yPos='150' showBelow='1' origW='300' origH='300' autoScale='1' scaleText='1' id='statusYellow' visible='0'>
								<annotation type='circle' xPos='0' yPos='0' radius='130' startAngle='0' endAngle='360' fillColor='CCCCCC,555555'  fillPattern='linear' fillAlpha='100,100'  fillRatio='50,50' fillAngle='-45'/>
								<annotation type='circle' xPos='0' yPos='0' radius='125' startAngle='0' endAngle='360' fillColor='555555,cccccc'  fillPattern='linear' fillAlpha='100,100'  fillRatio='50,50' fillAngle='-45'/>
								<annotation type='circle' xPos='0' yPos='0' radius='120' startAngle='0' endAngle='360' fillColor='222222,000000'  fillPattern='linear' fillAlpha='100,100'  fillRatio='30,70' fillAngle='-90'/>
								<annotation type='circle' xPos='0' yPos='0' radius='110' startAngle='0' endAngle='360' fillColor='feef00,c06816'  fillPattern='linear' fillAngle='270' fillRatio='50,50'/>
								<annotation type=\"circle\" xPos=\"0\" yPos=\"0\" radius=\"110\" fillPattern=\"radial\" fillColor=\"000000,000000\" fillAlpha=\"0,90\" fillRatio=\"60,40\" fillAngle=\"270\"/>
								<annotation type=\"circle\" xPos=\"0\" yPos=\"-16\" radius=\"90\" fillPattern=\"linear\" fillColor=\"000000,ffffff\" fillAlpha=\"15,0\" fillRatio=\"50,50\" fillAngle=\"270\"/>
								<annotation type='circle' xPos='0' yPos='0' radius='110' startAngle='355' endAngle='185' fillColor='000000' fillAngle='270' fillAlpha='40' fillRatio='50'/>
								<annotation type='line' xPos='0' yPos='10' toYPos='70' color='acc396' thickness='1'/>
								<annotation type='text' label='".$dados["label"]."' font='Arial' xPos='0' yPos='-25' align='center' fontcolor='FFFFFF' fontSize='14' isBold='1'/>
								<annotation type='text' label='' font='Arial' xPos='-7' yPos='45' align='right' vAlign='left' fontcolor='FFFFFF' fontSize='12' isBold='1'/>
								<annotation type='text' label='' font='Arial' xPos='7' yPos='45' align='left' vAlign='left' fontcolor='FFFFFF' fontSize='12' isBold='1'/>
							</annotationGroup>
							<annotationGroup xPos='150' yPos='150' showBelow='1' origW='300' origH='300' autoScale='1' scaleText='1' id='statusGreen' visible='0'>
								<annotation type='circle' xPos='0' yPos='0' radius='130' startAngle='0' endAngle='360' fillColor='CCCCCC,555555'  fillPattern='linear' fillAlpha='100,100'  fillRatio='50,50' fillAngle='-45'/>
								<annotation type='circle' xPos='0' yPos='0' radius='125' startAngle='0' endAngle='360' fillColor='555555,cccccc'  fillPattern='linear' fillAlpha='100,100'  fillRatio='50,50' fillAngle='-45'/>
								<annotation type='circle' xPos='0' yPos='0' radius='120' startAngle='0' endAngle='360' fillColor='222222,000000'  fillPattern='linear' fillAlpha='100,100'  fillRatio='30,70' fillAngle='-90'/>
								<annotation type='circle' xPos='0' yPos='0' radius='110' startAngle='0' endAngle='360' fillColor='0d8b44,98c93c'  fillPattern='linear' fillAngle='270' fillRatio='50,50'/>
								<annotation type=\"circle\" xPos=\"0\" yPos=\"0\" radius=\"110\" fillPattern=\"radial\" fillColor=\"000000,000000\" fillAlpha=\"0,90\" fillRatio=\"60,40\" fillAngle=\"270\"/>
								<annotation type=\"circle\" xPos=\"0\" yPos=\"-16\" radius=\"90\" fillPattern=\"linear\" fillColor=\"000000,ffffff\" fillAlpha=\"15,0\" fillRatio=\"50,50\" fillAngle=\"270\"/>
								<annotation type='circle' xPos='0' yPos='0' radius='110' startAngle='355' endAngle='185' fillColor='000000' fillAngle='270' fillAlpha='40' fillRatio='50'/>
								<annotation type='line' xPos='0' yPos='10' toYPos='70' color='acc396' thickness='1'/>
								<annotation type='text' label='".$dados["label"]."' font='Arial' xPos='0' yPos='-25' align='center' fontcolor='FFFFFF' fontSize='14' isBold='1'/>
								<annotation type='text' label='' font='Arial' xPos='-7' yPos='45' align='right' vAlign='left' fontcolor='FFFFFF' fontSize='12' isBold='1'/>
								<annotation type='text' label='' font='Arial' xPos='7' yPos='45' align='left' vAlign='left' fontcolor='FFFFFF' fontSize='12' isBold='1'/>
							</annotationGroup>
						</annotations>
					</Chart>
-
Please Angel, you can help me?
I want to change this data and not have success.
Please, help!
Thanks
Hi Angie, thank you!
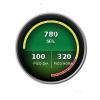
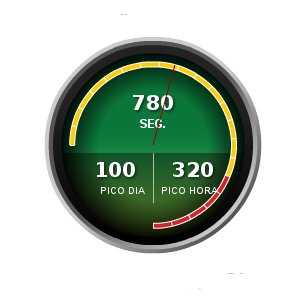
In Attach the style of my Gauge.
The red pointer is working as velocimeter respecting thresholds.
But the numbers i can't show converted in hours format, he's lost de zero values.
The propertie displayValue respect the thresholds and make the pointer or is only for visualization?
Thanks!
-
Hi Angie, thank you!
In Attach the style of my Gauge.
The red pointer is working as velocimeter respecting thresholds.
But the numbers i can't show converted in hours format, he's lost de zero values.
The propertie displayValue respect the thresholds and make the pointer or is only for visualization?
Thanks!
Hi,
Welcome to FusionCharts Forum!
You would need to pass the value as a string using <displayValue> attribute .
For more details, please refer to the link: http://www.fusioncha...ts/Ang_XML.html
Hope this helps.
-
Hi!
I use the Angular Gauge to show some values in pattern of hours and send this values for Fusico Chart in milliseconds.
I try to apply a number format to show my value in this pattern 05:04 (mm:ss), but i don't have success.
My chart is configure on this form:
<... numberScaleValue='60,60' numberScaleUnit=' , ' formatNumberScale='1' scaleRecursively='1' scaleSeparator=':' decimalPrecision='0'
But my hour is show in this pattern 5:4 and i need to show 05:04 (a zero reference).
How i can make this?
Thanks
How To Use Bold In Pie3D
in XML Issue
Posted · Report reply
Ohhhhhh god, so simply!
Thank you!
[]'
Flexvisino