
paragon_jomo
-
Content count
5 -
Joined
-
Last visited
Posts posted by paragon_jomo
-
-
Anyone? From looking at the documentation there doesn't seem to be a thing I can do. You cannot individually tell the pointers to appear on the top or bottom, only all of the pointers... I cannot use the tool tip for the value as it is used for something else. Any help appreciated.
-
-
Hi, thanks for the response. Here is the XML to generate the chart.
<?xml version="1.0"?>
<chart xmlns:xsi="http://www.w3.org/2001/XMLSchema-instance" xmlns:xsd="http://www.w3.org/2001/XMLSchema" showBorder="0" bgColor="E0E3E4" borderAlpha="100" numberSuffix="%25" ticksBelowGauge="1" pointerBorderColor="333333" valuePadding="0" baseFontColor="333333" lowerLimit="0" upperLimit="100" showGaugeBorder="0" gaugeFillMix="" annRenderDelay="0" animation="0" showShadow="0" pointerOnTop="1" minorTMNumber="0" pointerBgColor="FFFFFF" showTickMarks="0">
<colorRange><color minValue="0" maxValue="100" alpha="0" /></colorRange>
<annotations>
<annotationGroup showBelow="1" id="Grp1">
<annotation showBorder="1" fillRatio="47.420000000,6.460000000,46.120000000" borderThickness="1" borderColor="666666" type="rectangle" x="10" y="30" toX="288" toY="60" color="5C8A39,BC8904,851E1E" />
<annotation fillAngle="270" fillRatio="0, 95, 5" fillAlpha="0,60,5" type="rectangle" x="11" y="30" toX="287" toY="60" color="FFFFFF,FFFFFF,FFFFFF" />
</annotationGroup>
<annotationGroup showBelow="0" id="Grp2">
<annotation type="text" x="35" y="45" color="FFFFFF" size="9" bold="1" label="Foo Bar" />
<annotation type="text" x="150" y="45" color="FFFFFF" size="9" bold="1" label="Foo Bar 1" />
<annotation type="text" x="249" y="45" color="FFFFFF" size="9" bold="1" label="Foo Bar 2" />
</annotationGroup>
</annotations>
<pointers>
<pointer value="53.880000000" radius="8" toolText="Foo bar 1: <b>53.88</b>%" />
<pointer value="47.420000000" radius="8" toolText="Foo bar 2: <b>$0.00</b>" />
<pointer value="-0.990000000" radius="8" toolText="Foo bar 3<b>In Faa</b>" />
</pointers>
<styles>
<definition>
<style name="labelFont" type="font" color="FFFFFF" />
<style name="ValueFont" type="font" bgColor="FFFFFF" borderColor="000000" />
<style name="fontStyle" type="font" isHTML="1" />
</definition>
<application>
<apply toObject="Grp2" styles="labelFont" />
<apply toObject="GAUGELABELS" styles="labelFont" />
<apply toObject="TOOLTIP" styles="fontStyle" />
<apply toObject="VALUE" styles="ValueFont" />
</application>
</styles>
</chart>
-
Hi,
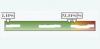
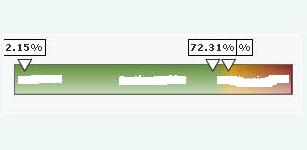
I have a linear gauge with multiple pointers on it. Depending on the data passed in, there are cases where some of the pointers may be very close to each other, causing the pointer at the front to obscure the pointer behind it. Attached is an example of what I am talking about.
Is there anyway to avoid this? Something like a setting to force the chart to avoid this, or to bring the pointer which is being hovered over to the front?
Thanks in advance.
Linear Gauge Multiple Pointers Obscuring Each Other
in Using FusionWidgets XT
Posted · Report reply
Hi,
I have a linear gauge with multiple pointers on it. Depending on the data passed in, there are cases where some of the pointers may be very close to each other, causing the pointer at the front to obscure the pointer behind it. Attached is an example of what I am talking about.
Is there anyway to avoid this? Something like a setting to force the chart to avoid this, or to bring the pointer which is being hovered over to the front?
Thanks in advance.
<?xml version="1.0"?>
<chart xmlns:xsi="http://www.w3.org/20...Schema-instance" xmlns:xsd="http://www.w3.org/2001/XMLSchema" showBorder="0" bgColor="E0E3E4" borderAlpha="100" numberSuffix="%25" ticksBelowGauge="1" pointerBorderColor="333333" valuePadding="0" baseFontColor="333333" lowerLimit="0" upperLimit="100" showGaugeBorder="0" gaugeFillMix="" annRenderDelay="0" animation="0" showShadow="0" pointerOnTop="1" minorTMNumber="0" pointerBgColor="FFFFFF" showTickMarks="0">
<colorRange><color minValue="0" maxValue="100" alpha="0" /></colorRange>
<annotations>
<annotationGroup showBelow="1" id="Grp1">
<annotation showBorder="1" fillRatio="47.420000000,6.460000000,46.120000000" borderThickness="1" borderColor="666666" type="rectangle" x="10" y="30" toX="288" toY="60" color="5C8A39,BC8904,851E1E" />
<annotation fillAngle="270" fillRatio="0, 95, 5" fillAlpha="0,60,5" type="rectangle" x="11" y="30" toX="287" toY="60" color="FFFFFF,FFFFFF,FFFFFF" />
</annotationGroup>
<annotationGroup showBelow="0" id="Grp2">
<annotation type="text" x="35" y="45" color="FFFFFF" size="9" bold="1" label="Foo Bar" />
<annotation type="text" x="150" y="45" color="FFFFFF" size="9" bold="1" label="Foo Bar 1" />
<annotation type="text" x="249" y="45" color="FFFFFF" size="9" bold="1" label="Foo Bar 2" />
</annotationGroup>
</annotations>
<pointers>
<pointer value="53.880000000" radius="8" toolText="Foo bar 1: <b>53.88</b>%" />
<pointer value="47.420000000" radius="8" toolText="Foo bar 2: <b>$0.00</b>" />
<pointer value="-0.990000000" radius="8" toolText="Foo bar 3<b>In Faa</b>" />
</pointers>
<styles>
<definition>
<style name="labelFont" type="font" color="FFFFFF" />
<style name="ValueFont" type="font" bgColor="FFFFFF" borderColor="000000" />
<style name="fontStyle" type="font" isHTML="1" />
</definition>
<application>
<apply toObject="Grp2" styles="labelFont" />
<apply toObject="GAUGELABELS" styles="labelFont" />
<apply toObject="TOOLTIP" styles="fontStyle" />
<apply toObject="VALUE" styles="ValueFont" />
</application>
</styles>
</chart>