
Charan
-
Content count
17 -
Joined
-
Last visited
Posts posted by Charan
-
-
How do I increase the gap between the chart ( Chart Canvas) and the Legend at the bottom?
-
Thank you for your reply. I tried this fix from my side but I don't see any change. Is this fix applicable for 'Javascript' charts aswell?
Appreciate your help.
Hi,
Thanks for your response.
Please try the same by setting <CanvasBGAlpha="100"> inside the <chart> element of your XML code.
Please find the screenshot attached for your reference.
Hope this helps.
-
Hi
I am working on similar kind of requirement and I am able to render 3D charts successfully..Can you share me the screenshot so that I can help you what exactly missing from your chart xml?
Hi, I downloaded v.3.2 as you have informed.
Previously i used older version so when there is no flash it opens as 2D chart now i have see the sample of 3.2 version it almost look like 3D even if there is no flash.
I know this is the new feature of FC. The problem is it is not rendering the fancy box or light-box which was worked fine under the older version of FC.
I think there is some issue between the java scripts of fancy-box and Fusion chart.. Is there any way u can assist ?
If i open the chart screen in separate page it open correctly in 3 D format but not rendering in fancy box.
Further, tell me the file names order wise which i have to add in the header .
Thanks for your all help.
-
Please try this:
<!DOCTYPE html>
<html>
<head id="Head1"><title>
Test
</title>
<script type="text/javascript" language="javascript" src="Charts/FusionCharts.js"> </script>
</head>
<body>
<div id="Container"></div>
<script type="text/javascript">
var xml = "<chart><categories><category label='Comprehension Reading Skills'/><category label='Interp. Anal. of Fict/Nonfiction'/><category label='Reading Independently (RI)'/><category
label='Reading, Analyzing, and Interpreting Text (RAIT)'/><category label='Reading, Analyzing, and Interpreting Literature-Fiction and Non-Fiction (RAIL)'/><category label='Open-Ended Response
(OE)'/></categories><dataset seriesname='Baseline'><set value='4.740000'/><set value='5.200000'/><set value='5.580000'/><set value='2.580000'/><set value='5.440000'/><set
value='6.140000'/></dataset><dataset seriesname='1st'><set value='8.300000'/><set value='1.700000'/><set value='5.900000'/><set value='9.900000'/><set value='1.700000'/><set
value='0.300000'/></dataset><dataset seriesname='2nd'><set value='0'/><set value='0'/><set value='0'/><set value='0'/><set value='0'/><set value='0'/></dataset><dataset seriesname='3rd'><set
value='10.000000'/><set value='14.290000'/><set value='14.290000'/><set value='0.000000'/><set value='20.000000'/><set value='0.000000'/></dataset><dataset seriesname='4th'><set value='0'/><set
value='0'/><set value='0'/><set value='0'/><set value='0'/><set value='0'/></dataset></chart>";
FusionCharts.setCurrentRenderer("javascript");
var myChart = new FusionCharts("Charts/StackedColumn2D.swf", "myChartId", "80%", "600", "0", "1");
myChart.setXMLData(xml);
myChart.render("Container");
</script>
</body>
</html>
I am trying to create a chart with multiple series. The following is my XML. The chart does not render using the RederChart method, it just displays "Chart." When using the RenderChartHtml method I get an invalid XML error. Not sure what I'm missing.
<chart caption='Subscale Averages' yAxisName='Percent' showBorder='0' formatNumberScale='0' showPercentValues='1' showPercentInToolTip='1' imageSave='1' imageSaveURL='FusionChartsSave.aspx'>
<categories>
<category name='Comprehension & Reading Skills'/>
<category name='Interp. & Anal. of Fict/Nonfiction'/>
<category name='Reading Independently (RI)'/>
<category name='Reading, Analyzing, and Interpreting Text (RAIT)'/>
<category name='Reading, Analyzing, and Interpreting Literature-Fiction and Non-Fiction (RAIL)'/>
<category name='Open-Ended Response (OE)'/>
</categories>
<dataset seriesname='Baseline'>
<set value='4.740000'/>
<set value='5.200000'/>
<set value='5.580000'/>
<set value='2.580000'/>
<set value='5.440000'/>
<set value='6.140000'/>
</dataset>
<dataset seriesname='1st'>
<set value='8.300000'/>
<set value='1.700000'/>
<set value='5.900000'/>
<set value='9.900000'/>
<set value='1.700000'/>
<set value='0.300000'/>
</dataset>
<dataset seriesname='2nd'>
<set value='0'/>
<set value='0'/>
<set value='0'/>
<set value='0'/>
<set value='0'/>
<set value='0'/>
</dataset>
<dataset seriesname='3rd'>
<set value='10.000000'/>
<set value='14.290000'/>
<set value='14.290000'/>
<set value='0.000000'/>
<set value='20.000000'/>
<set value='0.000000'/>
</dataset>
<dataset seriesname='4th'>
<set value='0'/>
<set value='0'/>
<set value='0'/>
<set value='0'/>
<set value='0'/>
<set value='0'/>
</dataset>
</chart>
-
Are you using the iPad/iPhone's safari browser. Or is this a iOS Navtive application rendering the WebUI Control?
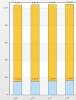
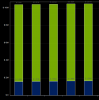
My Charts on my Ipad / Ipad2 / Iphone4 using both IOS 4 and IOS 5 are all black(see attachement), but the flash version of those charts are normal colored.
I am using Fusion Charts v 3.2.2 (XT)
I am inclding FusionCharts.js in my page and have the following Files in the same folder as FusionCharts.js
FusionCharts.HC.Charts.js
FusionCharts.HC.js
FusionCharts.jqueryplugin.js
jquery.min.js
-
What is the advantage of FusionChartXT? It suppose to render charts on iPad devices right? I have crated an iPad applcation that internally use WebUI control to render the HTML chart? So I don't understand what exactly I am missing here.
Thank you for your support so far.
Hi,
Apologies for the inconvenience.
I am afraid, we do not have complete support for the charts for native applications on iOS devices, as of now.
However, we are working on this and shall update you at the earliest.
Thank you for your continued patience and patronage.
-
I am using the device only..
Hi,
Could you please confirm if you are viewing this in the Emulator?
This would work in the device but not on the Emulator.
Hope this helps.

-
any updates on this?
Hi,
Could you please send us the sample XML so that we might test it?
Awaiting your reply.
-
I have attached html page here.. This working fine in browser.. But when I use this in iPad WEBUI control, I can't see any colors.
-
I am using FusionchartXT (latest) version. Getting issues while render in iPad application. It is not populating the colors. see the attachment..
-
Hi,
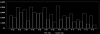
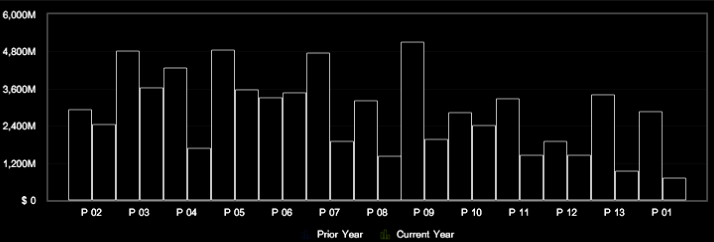
I am using a stack chart that displaying values for each chart separately. I want to display a sum instead of individual values. I tried to use <chart showSum="1"> but its not working as expected...
Can you help me out here? I am using Javascript charts!! I am not using the free version.
Thank you.
Here is my XML:
<?xml version="1.0" encoding="utf-16"?><chart showSum="1"><categories FontSize="10"><category Label="P 02 " ShowLabel="1" /><category Label="P 03 " ShowLabel="1" /><category Label="P 04 " ShowLabel="1" /><category Label="P 05 " ShowLabel="1" /><category Label="P 06 " ShowLabel="1" /><category Label="P 07 " ShowLabel="1" /><category Label="P 08 " ShowLabel="1" /><category Label="P 09 " ShowLabel="1" /><category Label="P 10 " ShowLabel="1" /><category Label="P 11 " ShowLabel="1" /><category Label="P 12 " ShowLabel="1" /><category Label="P 13 " ShowLabel="1" /><category Label="P 01 <br/> FY 12" ShowLabel="1" /></categories><dataset Alpha="100" SeriesName="UK" ShowValues="1"><set Alpha="80" Value="1594899.78" /><set Alpha="80" Value="1609059.00" /><set Alpha="80" Value="1631723.01" /><set Alpha="80" Value="1664971.32" /><set Alpha="80" Value="1684439.03" /><set Alpha="80" Value="1699559.44" /><set Alpha="80" Value="1713801.92" /><set Alpha="80" Value="1735067.81" /><set Alpha="80" Value="1775857.86" /><set Alpha="80" Value="1824606.65" /><set Alpha="80" Value="1864375.17" /><set Alpha="80" Value="1887188.69" /><set Alpha="80" Value="1922267.73" /></dataset><dataset Alpha="100" SeriesName="US" ShowValues="1"><set Alpha="80" Value="8803916.27" /><set Alpha="80" Value="8812984.36" /><set Alpha="80" Value="8806877.43" /><set Alpha="80" Value="8820940.46" /><set Alpha="80" Value="8805220.68" /><set Alpha="80" Value="8778861.63" /><set Alpha="80" Value="8772327.41" /><set Alpha="80" Value="8751417.00" /><set Alpha="80" Value="8742307.46" /><set Alpha="80" Value="8744868.26" /><set Alpha="80" Value="8760592.06" /><set Alpha="80" Value="8749916.08" /><set Alpha="80" Value="8734657.70" /></dataset></chart>
-
Can we display a sum value (datavalue) on top of the bar in StackedColumn2D chart? Instead of showing separately for each section?
-
Hi,
I am currently working on an iPad Application which extensively use Fusion charts v3. Can you let me know your implementation on a highlevel?
Thank you,
Charan
-
Hi
I am just a month old developer in Fusion Charts Product. So far I feel that it is truly an amazing Product.
I have one question related to XML generation method. Is there a way to generate XML data dynamically on a real time basis. Do you provide any plugin. So far, I am looping through database tables or using XSLT for creating the Chart XML. I have around 100+ charts to generate for an iPad Application.
Let me know if you have a better way to deal with this
Thank you,
Charan


Padding Between Chart Canvas And Legend
in General usage
Posted · Report reply
Thank you