
Surya
-
Content count
29 -
Joined
-
Last visited
Posts posted by Surya
-
-
Hi Ayan,
Please find the attachment containing the chart data source, which I had run in jsfiddle. I would like to set the upper limit of whisker to a smaller value, so that the box plots are viewable. I used the yAxisMaxValue attribute and set it to '100', but I guess it got overridden by the max value of Whisker.
Thanks,
Surya
-
Hi,
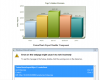
I am able to use the box and whisker chart and plot the chart. I have a problem, the box isn't visible properly due to higher maximum limit, and hence the box appears very small.
I have attached the chart image for your reference.
Please let me know if there is any way to trim the upper whisker so that the box plot can be rendered legible enough.

-
HI,
I am able to use your Box and whisker plot perfectly. But there is a specific requirement from my client, to display the Box plot in a horizontal way.
Is there any attribute that I can set, to convert the vertical box plot to horizontal one.
Please help.
Thanks and regards,
Suryanarayan
-
HI,
I am able to use your Box and whisker plot perfectly. But there is a specific requirement from my client, to display the Box plot in a horizontal way.
Is there any attribute that I can set, to convert the vertical box plot to horizontal one.
Please help.
Thanks and regards,
Suryanarayan
-
Hi,
Thanks for the reply. I am able to save the chart now.
But, I've got a new problem, I am refreshing the chart div on a drop-down selection action.
And once the chart gets rendered again. The 'Waiting' button refuses to change to 'Save' even after the export is 100% complete.
Pls help.
-
Hi,
We are using Fusioncharts XT, and we are trying to implement client-side export in our JSF project. We have followed the method that you have mentioned in your documentation, but we are unable to view the 'Save' button.
We tried implementing the server-side export and were able to do it successfully.
We have also set the global Flash player settings properly by viewing the previous post regarding this issue.
All we get is a javaScript error saying that 'FusionChartsExportObject is undefined'.
We are attaching the screenshot of the error,for our viewing.
-
Hi,
We've been using FusionCharts XT for our data analysis. Currently we are able to drill down on data in a 3D Bar Column graph, by selecting a single bar.
I would like to know if it is possible to select multiple bars on a single chart, and drill them down together. If yes, please let me know with a sample example
Thanks
-
Yes, I have tried. It is not displaying the drill down chart. There is no error displayed. The chart area is blank for the drilled down chart.
Please reply if you have any other suggestions with you for this issue. I am still stuck at the same point.
-
Hi,
Have you tried with " FusionChartsSR1-beta2.zip " attachment?
Please find the attachment.
Yes, I have tried. It is not displaying the drill down chart. There is no error displayed. The chart area is blank for the drilled down chart.
-
Hi,
Could you please try once with the latest JS files attached with the previous post?
Awaiting for your response.
I am trying with the latest JS files sent by you in the earlier post. I am still facing the same problem.
-
Hi,
We are not using the DataURL method. We are using the DataString method only to set the XML data for the chart. The XML data for the chart is present in a JSF variable.
I am using this line of my code in my XHTML page:
myChart.setXMLData("#{visualController.graphOutput}");
-
Hi,
Please try to enable the Compatibility Mode in IE 8 and see if this helps.
Hope this helps.
Hi,
Tried. No good..
 We are using pure Javascript functions in our webpage and not the XML embedded type. We are clueless as to why this is not working, as the code remains the same, which was working fine with Fusion Charts V 3.0...
 -
Hi,
Please find the latest JS files attached for your reference.
You would need to copy these JS files in your charts folder.
Hope this helps.
I copied the files into my charts folder. No change, I still get the same error. FYI, I am using the linked chart functionality of fusion charts to implement drill down. I'm able to get the initial chart, but am getting the error in the first level of drill down. The error points out to FusionCharts.js file....
Webpage error details
Message: Invalid argument.
Line: 76
Char: 261
Code: 0
URI: http://localhost:8080/gmproject/css/FusionCharts.js
-
Fusion Charts -3.2.2(XT)
Browser - IE 8
Os - Windows 7
-
Hi...
I am not using multiple chats in my web page. I am using only a single chart window. Now I am getting this error
Webpage error details
Timestamp: Fri, 25 Nov 2011 10:36:24 UTC
Message: Invalid argument.
Line: 76
Char: 261
Code: 0
URI: http://localhost:8080/gmproject/css/FusionCharts.js
-
Hi,
Thanks for the reply. I noticed that I was using StackedChart.swf, while I was providing data with Single-Series data. The graph renders now. But upon clicking the graph,the link does not work. I am using the same code as i had pasted in my previous post.I have changed only the chart type. It now shows a error saying.
Webpage error details
Timestamp: Fri, 25 Nov 2011 07:56:59 UTC
Message: A FusionChart oject with the specified id "myChartId" already exists. Renaming it to chartobject-1
Line: 27
Char: 481
Code: 0
URI: http://localhost:8080/gmproject/css/FusionCharts.js
I am pasting my code once again,
Code:
<div id="chartdiv" align="center">The chart will appear
within this DIV. This text will be replaced by the chart.</div>
<script
src="${facesContext.externalContext.requestContextPath}/css/FusionCharts.js"
language="JavaScript" />
<script type="text/javascript">
var myChart = new FusionCharts("images/charts/Column3D.swf", "myChartId", "800", "400", "0", "1");
myChart.setDataXML("#{visualController.graphOutput}");
myChart.render("chartdiv");
</script>
-
Hi,
It is a JSF project . Here is FusionChart related code from one of my xhtml pages. The value of "graphOutput" is hard-coded with
String graphOutput = "<chart caption='Weekly Sales Summary' xAxisName='Week' yAxisName='Amount' numberPrefix='$'> <set label='Week 1' value='14400' /> </chart>";
in visualController.java file. When I run the code it displays "No data to display".
<div id="chartdiv" align="center">The chart will appear
within this DIV. This text will be replaced by the chart.</div>
<script
src="${facesContext.externalContext.requestContextPath}/css/FusionCharts.js"
language="JavaScript" />
<script type="text/javascript">
var myChart = new FusionCharts("${facesContext.externalContext.requestContextPath}/images/charts/StackedColumn3D.swf", "myChartId", "800", "400", "0", "1");
alert("#{visualController.graphOutput}");
myChart.setDataXML("#{visualController.graphOutput}");
myChart.render("chartdiv");
</script>
<script type="text/javascript">
I am using FusionCharts 3.2.2, IE 8 and Windows 7 OS.
-
Any suggestions?. I'm stuck still.
-
Hi,
I had cleared my browser cache and the pop-up still keeps coming,upon clicking the graph. I have not made any changes in my XML. The only change I did was , replacing the .swf and .js files. No clue as to why this does'nt work.
-
Hi,
I am running from local file system only. And I had verified my Flash Settings to be similar to the one you have mentioned. Still no success..
 .. I had just replaced my old version .swf files and .js files with the new ones in my application repository. Expected it to work the same as before, didn't turn out to be..
 -
Hi,
I had upgraded from FusionCharts V 3.0 to V 3.2.2 and am working with linked charts. The linked charts were working fine with the older version, but now upon upgradation, the graphs render, but when I click the graph for a drill down , it pops up a window saying "Unable to download,Unspecified Error".. I had gone through the posts in the forum on the same issue and tried out the solutions mentioned,like I had tried replacing "link = "javascript:myJsMethod()"" with "j-myJsMethod", but it still did not work out. Is there a workaround for this issue as it is a little urgent.
-
Hi Angshu,
Just now figured out the hook!.. I had the JavaScript file "FusionChartsExportComponent.debug.js" and while including I had missed out the ."debug" in the filename.
 It had missed my eye all this while.The "Save" feature works clean as a whistle!!...
Thanks a ton for the support extended.

Hi,
Please find the latest JS files attached for your reference.
You would need to copy these JS files in your charts folder.
Hope this helps.
-
I am using FusionCharts v3.2.1. Downloaded from your site just last week.
Hi,
Thanks for your response.
Could you please confirm the FusionCharts version you are using?
Awaiting for your reply.
-
Hi!,
While I opened the HTML file, I noticed that it showed a Javascript error warning for that page. The error said "FusionChartsExportObject" in Line 24 of my code is "Undefined". Could you please clarify me on this and could it be the reason for me not viewing the "Save" button?
Hi,
Thank you very much for your appreciation.
Please check once the "Flash Player Global Security Settings" .
Please visit the forum thread : http://forum.fusionc...-or-save-chart/ for your reference.
Hope this works.


Export Charts to Server disk location and Add to Power Point
in General usage
Posted · Report reply
Hi,
I would like to export fusion charts and add it to power point slides at the click of a button.
I would be creating the slides using Apache POI. Can you let me know as to how I can save the charts to server disk location, so that I can refer the download path in my Java code to add the chart images to slides.''
Thanks,
Surya