
Upendar Srirangam
-
Content count
51 -
Joined
-
Last visited
Posts posted by Upendar Srirangam
-
-
Thank you for your swift response. Can you also confirm that export works on IE 8 and above browsers?
Hi Upendar,
Welcome to FusionCharts Forum.
You can export JavaScript chart as PNG,JPEG, PDF,SVG but not in PPT. However, you can use exported image into PPT.
Also, if you want to use FusionCharts into PowerPoint then you can use our another product Oomfo for PowerPoint. Oomfo is a simple yet powerful PowerPoint add-in that allows you to create FusionCharts into PowerPoint presentation.
Please refer the following links for more information:
http://docs.fusionch...ECOverview.html
Hope this helps!
-
Hi Team,
We have a requirement where if user clicks on the specific Bar of a Bar Chart, we need to show a new dialog window with actual data of that particular Bar in the Bar chart. Can you please furnish the details of how it can be done. ( We use Javascript Renderer). POC for the same is appreciated.
Thanks
Upendar.
-
Hi Fusion Charts Team,
We are licensed users of Fusion Charts and we have used Fusion Charts (Java script renderer)for one of our earlier application for IPad. Now we are planning to use for other new application in which export the chart as image/pdf/PPT feature is expected . Can you confirm on the feasibility and implementation part. POC for the same is appreciated. Based on this we need to confirm the usage of Fusion Charts since this is high priority requirement.
Thanks
Upendar.
-
We are using same version now.
Can you tell me in which version it works correct?
Thanks
Upendar.
Hi,
Thanks for your response.
Could you please confirm the FusionCharts version you are using?
In case you are using FusionCharts XT(3.2.2), I am afraid, legend would not appear if all values are null for that dataset.
Hope this helps.
-
Hi Team,
Below isthe sample data. For below XML one of the series called "FY 12 Plan" all the values are null and that series is not displayed.
We appreciate the quick response on this.
<?xml version="1.0" encoding="utf-16"?><chart AdjustDiv="0" AlternateHGridColor="000000,000000" Animation="1" BGAlpha="100,100" BGColor="000000" BaseFont="arial" BaseFontColor="FFFFFF" BaseFontSize="15" CanvasBGColor="000000" CanvasPadding="40" ConnectNullData="0" Decimals="1" DefaultAnimation="1" DivLineAlpha="100" DivLineColor="666666" DivLineIsDashed="0" DivLineThickness="1" DrawAnchors="1" ExportAction="Save" ExportAtClient="0" ExportDataFormattedVal="0" ExportDataQualifier="Tab" ExportDataSeparator="Tab" ExportEnabled="0" ExportShowMenuItem="0" ExportTargetWindow="Self" ForceDecimals="0" FormatNumber="1" FormatNumberScale="0" LabelDisplay="Wrap" LegendAllowDrag="0" LegendBGAlpha="100" LegendBGColor="000000" LegendBorderColor="CCCCCC" LegendBorderThickness="1" LegendIconScale="2" LegendMarkerCircle="0" LegendPosition="Bottom" LegendShadow="1" LineDashGap="0" LineDashLen="10" LineDashed="0" LineThickness="1" LogoPosition="TL" NumberSuffix="%" OutCnvBaseFont="arial" OutCnvBaseFontSize="10" OverlapColumns="0" Palette="1" PaletteColors="002776,92D400,FFFFFF,00A1DE" PlotBorderColor="ffffff" PlotSpacePercent="40" ReverseLegend="0" RotateLabels="0" RotateValues="0" RotateYAxisName="1" SFormatNumber="1" SFormatNumberScale="1" SeriesNameInToolTip="1" SetAdaptiveSYMin="0" SetAdaptiveYMin="0" ShowAboutMenuItem="1" ShowAlternateHGridColor="0" ShowBorder="0" ShowCanvasBG="1" ShowCanvasBase="0" ShowDivLineSecondaryValue="0" ShowDivLineValues="1" ShowExportDataMenuItem="0" ShowExportDialog="1" ShowLabels="1" ShowLegend="1" ShowLimits="1" ShowPlotBorder="1" ShowSecondaryLimits="0" ShowShadow="1" ShowToolTip="1" ShowToolTipShadow="0" ShowVLineLabelBorder="1" ShowValues="1" ShowYAxisValues="1" ShowZeroPlane="1" SlantLabels="0" ToolTipBGColor="000000" ToolTipBorderColor="CCCCCC" Use3DLighting="0" Use3DLineShift="0" UseRoundEdges="1" YAxisValueDecimals="1" YAxisValuesPadding="10" ZeroPlaneColor="#FFFFFF" ZeroPlaneShowBorder="1" ZeroPlaneThickness="1" is2D="1" plotgradientcolor="" YAxisMaxValue="88.32996" YAxisMinValue="0" NumDivLines="4"><categories FontSize="10"><category Label="P1" ShowLabel="1" /><category Label="P2" ShowLabel="1" /><category Label="P3" ShowLabel="1" /><category Label="P4" ShowLabel="1" /><category Label="P5" ShowLabel="1" /><category Label="P6" ShowLabel="1" /><category Label="P7" ShowLabel="1" /><category Label="P8" ShowLabel="1" /><category Label="P9" ShowLabel="1" /><category Label="P10" ShowLabel="1" /><category Label="P11" ShowLabel="1" /><category Label="P12" ShowLabel="1" /><category Label="P13" ShowLabel="1" /></categories><dataset Alpha="100" SeriesName="FY 11 Actual" ShowValues="0" anchorBgColor="002776" anchorBorderColor="002776" lineThickness="2"><set Alpha="80" Color="" Value="64.7" /><set Alpha="80" Color="" Value="63.0" /><set Alpha="80" Color="" Value="71.6" /><set Alpha="80" Color="" Value="71.1" /><set Alpha="80" Color="" Value="70.1" /><set Alpha="80" Color="" Value="73.2" /><set Alpha="80" Color="" Value="65.7" /><set Alpha="80" Color="" Value="50.2" /><set Alpha="80" Color="" Value="82.2" /><set Alpha="80" Color="" Value="88.3" /><set Alpha="80" Color="" Value="83.2" /><set Alpha="80" Color="" Value="74.8" /><set Alpha="80" Color="" Value="67.9" /></dataset><dataset Alpha="100" SeriesName="FY 12 Actual" ShowValues="0" anchorBgColor="92D400" anchorBorderColor="92D400" lineThickness="2"><set Alpha="80" Color="" Value="62.5" /><set Alpha="80" Color="" Value="36.2" /><set Alpha="80" Color="" /><set Alpha="80" Color="" /><set Alpha="80" Color="" /><set Alpha="80" Color="" /><set Alpha="80" Color="" /><set Alpha="80" Color="" /><set Alpha="80" Color="" /><set Alpha="80" Color="" /><set Alpha="80" Color="" /><set Alpha="80" Color="" /><set Alpha="80" Color="" /></dataset><dataset Alpha="100" RenderAs="Line" SeriesName="FY 12 Plan" ShowValues="0" anchorBgColor="FFFFFF" anchorBorderColor="FFFFFF" lineThickness="2"><set Alpha="80" Color="" /><set Alpha="80" Color="" /><set Alpha="80" Color="" /><set Alpha="80" Color="" /><set Alpha="80" Color="" /><set Alpha="80" Color="" /><set Alpha="80" Color="" /><set Alpha="80" Color="" /><set Alpha="80" Color="" /><set Alpha="80" Color="" /><set Alpha="80" Color="" /><set Alpha="80" Color="" /><set Alpha="80" Color="" /></dataset></chart>
Regards,
Upendar.
Hi,
Thanks for your post.
Could you please send us the XML code to test it from our end?
Awaiting for your response.
-
Hi,
We are a licensed user for Fusion Chatrs.
We have a requirement to hide Top and Right border for all the charts in our IPad applications (Javascript renderer)
Can you please let us know if there is any way for achieving this.
Appreciate the quick response on this.
Thanks,
Upendar
-
Can I have response on this please. We have project deadlines.
Thanks
Upendar.
Hi,
We are licensed users of Fusion Charts.
For Line2D charts, we are getting chart border which we are not supposed to get. We have set the ShowBorder attribute to false but still border is not hidden (ONLY for LINE charts, other charts its working fine)
Below is the xml of our chart
<?xml version="1.0" encoding="utf-16"?><graph AdjustDiv="0" AlternateHGridColor="000000,000000" Animation="1" BGAlpha="100" BGColor="000000" BaseFont="arial" BaseFontColor="FFFFFF" BaseFontSize="15" CanvasBGColor="000000" CanvasPadding="40" ConnectNullData="0" Decimals="1" DefaultAnimation="1" DivLineColor="555555" DivLineIsDashed="0" DivLineThickness="0" DrawAnchors="1" ExportAction="Save" ExportAtClient="0" ExportDataFormattedVal="0" ExportDataQualifier="Tab" ExportDataSeparator="Tab" ExportEnabled="0" ExportShowMenuItem="0" ExportTargetWindow="Self" ForceDecimals="0" FormatNumber="1" FormatNumberScale="0" LabelDisplay="Wrap" LabelStep="0" LegendAllowDrag="0" LegendBGAlpha="100" LegendBGColor="000000" LegendBorderColor="cccccc" LegendBorderThickness="1" LegendMarkerCircle="0" LegendPosition="Bottom" LegendShadow="1" LineDashGap="5" LineDashLen="10" LineDashed="0" LineThickness="1" LogoPosition="TL" NumberSuffix="%" OutCnvBaseFont="arial" OutCnvBaseFontSize="9" Palette="1" PaletteColors="002776,92D400,00A1DE,FFFFFF,FFE303" PlaceValuesInside="0" ReverseLegend="0" RotateLabels="0" RotateValues="0" RotateYAxisName="1" SeriesNameInToolTip="1" SetAdaptiveYMin="0" ShowAboutMenuItem="0" ShowAlternateHGridColor="0" ShowAlternateVGridColor="0" ShowBorder="0" ShowDivLineValues="1" ShowExportDataMenuItem="0" ShowExportDialog="1" ShowLabels="1" ShowLegend="1" ShowLimits="1" ShowShadow="1" ShowToolTip="1" ShowToolTipShadow="0" ShowVLineLabelBorder="0" ShowValues="1" ShowYAxisValues="1" ShowZeroPlane="1" SlantLabels="0" ToolTipBGColor="000000" ToolTipBorderColor="cccccc" VDivLineIsDashed="0" YAxisMaxValue="27.9" YAxisMinValue="-18.9" YAxisValueDecimals="0" YAxisValuesPadding="10" plotgradientcolor="" legendIconScale="2"><categories FontSize="10"><category Label="P 3 " ShowLabel="1" /><category Label="P 4 " ShowLabel="1" /><category Label="P 5 " ShowLabel="1" /><category Label="P 6 " ShowLabel="1" /><category Label="P 7 " ShowLabel="1" /><category Label="P 8 " ShowLabel="1" /><category Label="P 9 " ShowLabel="1" /><category Label="P 10 " ShowLabel="1" /><category Label="P 11 " ShowLabel="1" /><category Label="P 12 " ShowLabel="1" /><category Label="P 13 " ShowLabel="1" /><category Label="P 1 <br/> FY 12" ShowLabel="1" /><category Label="P 2 " ShowLabel="1" /></categories><dataset Alpha="100" SeriesName="Rate" ShowValues="0" anchorBgColor="002776" anchorBorderColor="002776" lineThickness="2"><set Alpha="80" Color="" Value="-4.9" /><set Alpha="80" Color="" Value="-4.2" /><set Alpha="80" Color="" Value="-3.6" /><set Alpha="80" Color="" Value="-3.1" /><set Alpha="80" Color="" Value="-1.6" /><set Alpha="80" Color="" Value="-0.6" /><set Alpha="80" Color="" Value="-0.4" /><set Alpha="80" Color="" Value="0.0" /><set Alpha="80" Color="" Value="0.8" /><set Alpha="80" Color="" Value="1.4" /><set Alpha="80" Color="" Value="1.2" /><set Alpha="80" Color="" Value="0.4" /><set Alpha="80" Color="" Value="-0.7" /></dataset><dataset Alpha="100" SeriesName="EPP" ShowValues="0" anchorBgColor="92D400" anchorBorderColor="92D400" lineThickness="2"><set Alpha="80" Color="" Value="-9.5" /><set Alpha="80" Color="" Value="-8.5" /><set Alpha="80" Color="" Value="-5.9" /><set Alpha="80" Color="" Value="-4.9" /><set Alpha="80" Color="" Value="-3.6" /><set Alpha="80" Color="" Value="-3.5" /><set Alpha="80" Color="" Value="-3.3" /><set Alpha="80" Color="" Value="-1.7" /><set Alpha="80" Color="" Value="1.0" /><set Alpha="80" Color="" Value="2.1" /><set Alpha="80" Color="" Value="3.1" /><set Alpha="80" Color="" Value="1.9" /><set Alpha="80" Color="" Value="-0.7" /></dataset><dataset Alpha="100" SeriesName="Net Earnings" ShowValues="0" anchorBgColor="00A1DE" anchorBorderColor="00A1DE" lineThickness="2"><set Alpha="80" Color="" Value="-12.4" /><set Alpha="80" Color="" Value="-11.4" /><set Alpha="80" Color="" Value="-8.7" /><set Alpha="80" Color="" Value="-7.5" /><set Alpha="80" Color="" Value="-6.0" /><set Alpha="80" Color="" Value="-5.6" /><set Alpha="80" Color="" Value="-5.1" /><set Alpha="80" Color="" Value="-3.3" /><set Alpha="80" Color="" Value="-0.5" /><set Alpha="80" Color="" Value="0.8" /><set Alpha="80" Color="" Value="2.0" /><set Alpha="80" Color="" Value="1.2" /><set Alpha="80" Color="" Value="-4.7" /></dataset><dataset Alpha="100" SeriesName="Hours" ShowValues="0" anchorBgColor="FFFFFF" anchorBorderColor="FFFFFF" lineThickness="2"><set Alpha="80" Color="" Value="-5.3" /><set Alpha="80" Color="" Value="-4.6" /><set Alpha="80" Color="" Value="-2.9" /><set Alpha="80" Color="" Value="-2.4" /><set Alpha="80" Color="" Value="-2.2" /><set Alpha="80" Color="" Value="-2.1" /><set Alpha="80" Color="" Value="-1.3" /><set Alpha="80" Color="" Value="-0.2" /><set Alpha="80" Color="" Value="0.9" /><set Alpha="80" Color="" Value="1.6" /><set Alpha="80" Color="" Value="1.8" /><set Alpha="80" Color="" Value="2.4" /><set Alpha="80" Color="" Value="0.2" /></dataset><dataset Alpha="100" SeriesName="Revenue" ShowValues="0" anchorBgColor="FFE303" anchorBorderColor="FFE303" lineThickness="2"><set Alpha="80" Color="" Value="-10.0" /><set Alpha="80" Color="" Value="-8.6" /><set Alpha="80" Color="" Value="-6.4" /><set Alpha="80" Color="" Value="-5.4" /><set Alpha="80" Color="" Value="-3.7" /><set Alpha="80" Color="" Value="-2.7" /><set Alpha="80" Color="" Value="-1.7" /><set Alpha="80" Color="" Value="-0.2" /><set Alpha="80" Color="" Value="1.7" /><set Alpha="80" Color="" Value="3.0" /><set Alpha="80" Color="" Value="3.0" /><set Alpha="80" Color="" Value="2.8" /><set Alpha="80" Color="" Value="-0.5" /></dataset></graph>
Regards,
Upendar
-
Hi,
Thanks for your swift response.
We cannot hide Zeroplane as client has requested to show ZeroPlane.
Is there any other solution you can suggest?
Regards,
Upendar.
Hi,
Thanks for your post.
Please note that the default value of <numDivLines> attribute is 4 in FusionCharts.
In FusionCharts, the axis limits encompasses all values present in the chart i.e., no data value can be below the minimum y-axis value or above maximum y-axis value - they have to be within the axis range. Even if you force an axis limit that is lower/higher than this, FusionCharts will automatically adjust it.
To avoid overlapping, please try by setting <showZeroPlane='0'> and <zeroPlaneAlpha='0'> attribute inside the <chart> element.
More details at : http://www.fusioncha.../ZeroPlane.html
Hope this helps.
-
Hi,
Can I have response on this. At this moment this is our roadblock.
Thanks
Upendar.
-
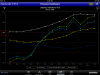
Please find the attached screenshot.
We have set YAxisMax and YAxisMin (Which is must for some other requirement.)
Regards,
Upendar.
Hi,
Thanks for your post.
Could you please send us a screenshot or any live link of your requirement?
Awaiting for your response.
-
Hi Fusion Charts team,
We are licensed user of Fusion Charts.
We need what is the default value for NumDivLines attribute for any chart. Please let us know the logic if possible.
We have an issue in one of our IPad application which MUST display Zero Plane.
When we are showing Zero plane, we also getting a div line at the value 0.2 which is causing overlapping the two div lines. We need to make the interval so that Zero should be one of the div lines.
We appreciate quick response on this.
Thanks
Upendar
-
Hi Team,
I got it resolved using "yAxisValueDecimals" attribute.
Thanks,
Upendar.
Hi Fusion Charts team,
We are using Licensed version of Fusion Charts for one of our IPad Apps (Java script renderer)
We want to know how number of div lines calculated by default in Fusion Charts. We have a requirement that we should show only whole numbers on yAxis scale. It can be solved using Decimals attribute but this should not apply for actual plot values.
I should not get Div lines at floating point values.
What is the default value given for NumDivLines
Regards,
Upendar.
-
HI,
We are using Fusion Charts licensed version for one of our IPad applications.
For one of the charts we have 3 legends, i.e we have 3 DataSets. For one of hte datasets we are getting null for all the columns, which is resulted completely hiding the Legend.
Is there any way for displaying Legend, even if all the values are null.
We have set the ConnectNullData to false as per the requirement.
We appreciate the quick response on this.
Thanks
Upendar,
-
Can you please respond to this. Your response has to be communicated to our client as can it be done or it is a limitation of Fusion Chart
regards,
Upendar
-
Hi Fusion Charts team,
We are using Fusion Chart licensed version for one of our IPad application.
We have a requirement that if any value is near to zero, we should hide that particular div line. (Showing Zero plane is mandatory which is causing to overlap the div line with Zero plane.)
Is there any possibility to achieve this?
Thanks
Upendar.
-
Hi FusionCharts team,
We are using Fusion Charts licensed version.
For MSCombi2D chart, we have the issues with Lines in the combi chart. When there is "0" for any of the category values, it should not plot that. But Line is drawn at Zero.
Is there any way that we can avoid Line get plotted for Zero values. (Columns wont be plotted if values is zero.. we need similar functionality for Line as well)
We appreciate the quick response.
Regards,
Upendar
-
Thank you very much for the quick response. The problem has been resolved.
Regards,
Upendar.
Hi Upendar,
Please note that you had set the attribute "showZeroPlane" to '0' in the <chart> element which is hiding the zero plane.
Could you please try setting the same attribute to '1' and see if that helps?
Hope this helps.

-
HI,
We are using Fusion Charts licensed version. For all the charts we are setting YaxisMaxValue and YAxisMinValue attributes.
When we set this, then value is varying from negative values to Positive values, Zero is missing. Is there anyway that we can mandate plotting Zero value on YAxis irrespective of YAxis Max and Min Values.
We appreciate quick response. Below is our sample data. (For Line Chart)
Note: We are using Javascript renderer as it is an IPad application.
<?xml version="1.0" encoding="utf-16"?><graph AdjustDiv="0" AlternateHGridColor="000000,000000" Animation="1" BGAlpha="100" BGColor="000000" BaseFont="arial" BaseFontColor="FFFFFF" BaseFontSize="11" CanvasBGColor="000000" CanvasPadding="40" ConnectNullData="0" Decimals="1" DefaultAnimation="1" DivLineColor="555555" DivLineIsDashed="0" DivLineThickness="2" DrawAnchors="1" ExportAction="Save" ExportAtClient="0" ExportDataFormattedVal="0" ExportDataQualifier="Tab" ExportDataSeparator="Tab" ExportEnabled="0" ExportShowMenuItem="0" ExportTargetWindow="Self" ForceDecimals="0" FormatNumber="1" FormatNumberScale="1" LabelDisplay="Wrap" LegendAllowDrag="0" LegendBGAlpha="100" LegendBGColor="000000" LegendBorderColor="cccccc" LegendBorderThickness="1" LegendMarkerCircle="0" LegendPosition="Bottom" LegendShadow="1" LineDashGap="5" LineDashLen="10" LineDashed="0" LineThickness="1" LogoPosition="TL" NumberSuffix="%" OutCnvBaseFont="arial" OutCnvBaseFontSize="10" Palette="1" PaletteColors="FFFFFF,00A1DE,92D400" PlaceValuesInside="0" ReverseLegend="0" RotateLabels="0" RotateValues="0" RotateYAxisName="1" SeriesNameInToolTip="1" SetAdaptiveYMin="0" ShowAboutMenuItem="0" ShowAlternateHGridColor="0" ShowAlternateVGridColor="0" ShowBorder="1" ShowDivLineValues="1" ShowExportDataMenuItem="0" ShowExportDialog="1" ShowLabels="1" ShowLegend="1" ShowLimits="1" ShowShadow="1" ShowToolTip="1" ShowToolTipShadow="0" ShowVLineLabelBorder="0" ShowValues="1" ShowYAxisValues="1" ShowZeroPlane="0" SlantLabels="0" ToolTipBGColor="000000" ToolTipBorderColor="cccccc" VDivLineIsDashed="0" YAxisMaxValue="41.327" YAxisMinValue="-30.24" YAxisValuesPadding="10" plotgradientcolor=""><categories FontSize="10"><category Label="P 3 " ShowLabel="1" /><category Label="P 4 " ShowLabel="1" /><category Label="P 5 " ShowLabel="1" /><category Label="P 6 " ShowLabel="1" /><category Label="P 7 " ShowLabel="1" /><category Label="P 8 " ShowLabel="1" /><category Label="P 9 " ShowLabel="1" /><category Label="P 10 " ShowLabel="1" /><category Label="P 11 " ShowLabel="1" /><category Label="P 12 " ShowLabel="1" /><category Label="P 13 " ShowLabel="1" /><category Label="P 1 <br/> FY 10" ShowLabel="1" /><category Label="P 2 " ShowLabel="1" /></categories><dataset Alpha="100" SeriesName="Total" ShowValues="0" anchorBgColor="FFFFFF" anchorBorderColor="FFFFFF"><set Alpha="80" Color="" Value="5.08" /><set Alpha="80" Color="" Value="5.21" /><set Alpha="80" Color="" Value="4.11" /><set Alpha="80" Color="" Value="3.77" /><set Alpha="80" Color="" Value="3.09" /><set Alpha="80" Color="" Value="2.55" /><set Alpha="80" Color="" Value="1.56" /><set Alpha="80" Color="" Value="0.47" /><set Alpha="80" Color="" Value="-0.20" /><set Alpha="80" Color="" Value="-0.51" /><set Alpha="80" Color="" Value="-0.16" /><set Alpha="80" Color="" Value="0.32" /><set Alpha="80" Color="" Value="0.49" /></dataset><dataset Alpha="100" SeriesName="US" ShowValues="0" anchorBgColor="00A1DE" anchorBorderColor="00A1DE"><set Alpha="80" Color="" Value="-23.14" /><set Alpha="80" Color="" Value="-23.57" /><set Alpha="80" Color="" Value="-25.14" /><set Alpha="80" Color="" Value="-26.59" /><set Alpha="80" Color="" Value="-28.14" /><set Alpha="80" Color="" Value="-29.95" /><set Alpha="80" Color="" Value="-30.05" /><set Alpha="80" Color="" Value="-30.24" /><set Alpha="80" Color="" Value="-29.72" /><set Alpha="80" Color="" Value="-30.19" /><set Alpha="80" Color="" Value="-29.21" /><set Alpha="80" Color="" Value="-27.37" /><set Alpha="80" Color="" Value="-24.70" /></dataset><dataset Alpha="100" SeriesName="India" ShowValues="0" anchorBgColor="92D400" anchorBorderColor="92D400"><set Alpha="80" Color="" Value="28.22" /><set Alpha="80" Color="" Value="28.78" /><set Alpha="80" Color="" Value="29.25" /><set Alpha="80" Color="" Value="30.36" /><set Alpha="80" Color="" Value="31.23" /><set Alpha="80" Color="" Value="32.50" /><set Alpha="80" Color="" Value="31.61" /><set Alpha="80" Color="" Value="30.71" /><set Alpha="80" Color="" Value="29.52" /><set Alpha="80" Color="" Value="29.68" /><set Alpha="80" Color="" Value="29.05" /><set Alpha="80" Color="" Value="27.69" /><set Alpha="80" Color="" Value="25.19" /></dataset></graph>
Thanks
Upendar.
-
Can you please respond to this query. Is there a solution to this?
Thank you for your reply. I tried this fix from my side but I don't see any change. Is this fix applicable for 'Javascript' charts aswell?
Appreciate your help.
-
Thanks for the Reply.
Regards,
Upendar
Hi,
Thanks for your post.
Please try the same by setting <color> attribute inside the <set> element of your XML code.
Ex: <set Alpha="80" Value="62.28753240758536" color="FFFF000"/>
For multi-series charts, you can define the color of data-sets at dataset level. However, if you wish to highlight a particular data element, you can specify its color at "set" level using this attribute. This attribute accepts hex color codes without #.
Hope this helps.
-
HI,
Can you please suggest any way that allows to specify colors for Bars. (For Javascript Charts)
We have below chart where we have a single Series. As it is a single series we are getting same color for all the Categories-Plots.
Is there any way that we can assign specific color to each bar.
Appreciate quick response.
Regards,
Upendar.
<?xml version="1.0" encoding="utf-16"?><chart AdjustDiv="1" AlternateHGridColor="000000,000000" Animation="0" BGAlpha="100" BGColor="000000" BaseFont="arial" BaseFontColor="FFFFFF" BaseFontSize="9" CanvasBGAlpha="000000" CanvasBGColor="000000" CanvasPadding="40" Decimals="1" DefaultAnimation="0" DivLineColor="555555" DivLineIsDashed="0" DivLineThickness="1" ExportAction="Save" ExportAtClient="0" ExportDataFormattedVal="0" ExportDataQualifier="Tab" ExportDataSeparator="Tab" ExportEnabled="0" ExportShowMenuItem="0" ExportTargetWindow="Self" ForceDecimals="0" FormatNumber="1" FormatNumberScale="1" LabelDisplay="Wrap" LegendAllowDrag="0" LegendBGAlpha="100" LegendBGColor="000000" LegendBorderColor="CCCCCC" LegendBorderThickness="1" LegendMarkerCircle="0" LegendPosition="Bottom" LegendShadow="1" LogoPosition="TL" OutCnvBaseFont="arial" OutCnvBaseFontSize="10" Palette="1" PaletteColors="002776,92D400,00A1DE" PlaceValuesInside="0" PlotBorderColor="FFFFFF" PlotBorderDashGap="0" PlotBorderDashLen="0" PlotBorderDashed="0" PlotGradientColor="" PlotSpacePercent="40" ReverseLegend="0" RotateLabels="0" RotateValues="0" RotateYAxisName="1" SeriesNameInToolTip="1" SetAdaptiveYMin="0" ShowAboutMenuItem="0" ShowAlternateHGridColor="0" ShowBorder="1" ShowDivLineValues="1" ShowExportDataMenuItem="0" ShowExportDialog="1" ShowLabels="1" ShowLegend="0" ShowLimits="1" ShowPlotBorder="1" ShowShadow="0" ShowToolTip="1" ShowToolTipShadow="0" ShowVLineLabelBorder="1" ShowValues="1" ShowYAxisValues="1" SlantLabels="0" ToolTipBGColor="000000" ToolTipBorderColor="cccccc" Use3DLighting="0" UseRoundEdges="1" YAxisMaxValue="68.51629" YAxisMinValue="0" YAxisValuesPadding="10"><categories FontSize="10"><category Label="FY 11 Actual" ShowLabel="1" /><category Label="FY 12 Actual" ShowLabel="1" /><category Label="FY 12 Plan" ShowLabel="1" /></categories><dataset Alpha="100" SeriesName="YTD" ShowValues="0"><set Alpha="80" Value="62.28753240758536" /><set Alpha="80" Value="46.65305944099121" /><set Alpha="80" Value="0" /></dataset></chart>
-
If you check your screenshot, it is missing YAxis and XAxis lines.. I mean Line is missing. Can you please recheck once and let us know..
Regards,
Upendar.
Hi,
Thanks for your post.
I am afraid, we are unable to replicate the issue, as the code is working fine from our end.
Please find the screenshot attached for your reference.

Bubble Cahrt--Multiple X Axis Yaxis On The Chart
in General usage
Posted · Edited by Upendar Srirangam · Report reply
Hi
We are licensed users of Fusion Charts. Can you help us to implement the bubble chart in the attached manner. Please respond ASAP since we need to confirm the feasibility. Also can you please guide us if we can click on a bubble to show the Title of the bubble and make it editable and fire a javascript event.