
Emilio
-
Content count
32 -
Joined
-
Last visited
Posts posted by Emilio
-
-
That's very helpful. Thank you!
-
Hello,
I'm trying to format the maxValues found in the color range object. I'd like them to include commas as thousands separators. If I supply the values pre-formatted (with commas), the map gives me unexpected results.
Please check out my fiddle. Specifically, I'd like the maxValues 1470 and 7042 to have comma seperators.
Thanks,
Emilio
-
Thank you, Akash. I have another question on formatting the numbers in the color scale, but I'll post that as a separate question.
Emilio
-
Hello,
I've referenced this fiddle of a USA DMA chart over the last few years and it's always displayed the colors correctly. But now it appears to only be paying attention to one of the colors. The ones associated with the color objects don't appear to be having an effect.
Did something change with this map recently to break this?
Also, is there a way I can reference older FusionCharts/Maps js files when testing with fiddles? I only know how to get the latest js files.
Just in case the link doesn't work, attached is the JS portion of the fiddle.
Thanks,
Emilio
-
Hello FusionCharts,
I've been thinking about this a little more and I guess what I'm asking is if there's a way to make those two objects (bar and line) aware of each other. Am I right in thinking that they're not currently? So, if my chart is small enough, then there's likely to be overlapping of elements. Is that correct?
Thanks.
-
Our charts have a height smaller than what you show. If you change the height on the fiddle chart to something around 150, you'll see overlapping.
Any thoughts on that, or my other question?
Thanks in advance.
-
Hello,
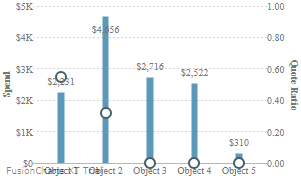
Is there any way to avoid the collision that can happen between bar value and line dot, as shown in attached screenshot? Specifically, the collision occurs over the first bar where the bar value and line dot want to occupy the same space.
Secondly, I've requested that the bar values be placed outside of the bars but the 2nd bar's value isn't cooperating. I believe this has to do with the amount of space above the bar. Is there a way to make sure there's always enough room above the bars to display the values so that no overlap happens?
Thanks,
Emilio
-
I appreciate the offer, but I don't think that would be a better solution for my particular scenario than what I've worked up: adding a buffer zone to the top of the chart by manipulating the axis max value attributes. The reason I say this is because there will inevitably be times when the bars collide with the vline label. And if the vline label background is transparent, then the text may get lost in the bar - especially if the two colors are the same or similar. This is not something I had foreseen when I originally posted my question.
I don't know if your proposed change would help anyone else, but please don't make the change on my behalf.
Thanks!
Emilio
-
Hello,
Can you share the formula that FusionCharts uses when calculating the yAxisMaxValue?
I'm overriding it for one of them, but I want FusionCharts to calculate the other one. However, the adjustDiv attribute doesn't work that way. By setting this to False, both axis are left for manual calculation, as well as the number of div lines.
If I knew what formula FC uses for calculating this, I could override one of them and supply this formula to the other one.
Thanks,
Emilio
-
Hello Prerana,
Thanks for the tips. Using the transparency as I mentioned it originally doesn't fix the problem. As you mentioned, it is not supported.
I like your suggestions for using annotations, but haven't implemented that at this point. Instead, I made the label background the same color as the canvas, removed the label's border, and added some padding at the top of the chart (by using the pYAxisMaxValue attribute) so that no bars get occluded by the vline label.
Thanks,
Emilio
-
Hello,
I have a chart that is making use of a vline. The vline has a label whose background I'd like to be transparent. Is this possible to do?
I've tried the data label attribute 'labelBgAlpha', but that didn't seem to work for the vline label.
Here is a sample jsfiddle, where you can see a bar getting clipped by the vline label: https://jsfiddle.net/3milio/ps62tnz0/.
Thanks,
Emilio
-
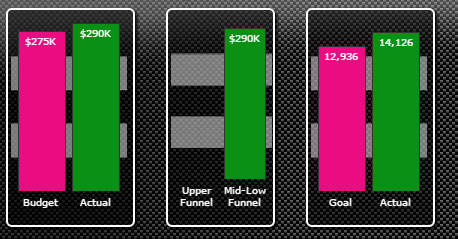
I should also mention that this issue is with version 3.2.2 of Fusioncharts, and the XML for the first chart is pasted below.
<chart Decimals="0" aboutMenuItemLabel="Export to Excel" aboutMenuItemLink="swfXML.aspx?ID=ColumnChart|160599|158229|10/24/2016|10/30/2016|158229.158230.158231.160598.160599|Week|0|0|E" alternateHGridColor="" baseFontColor="FFFFFF" bgAlpha="0,0" bgColor="000000" bgRatio="0" canvasBgAlpha="0" canvasBgAngle="0" canvasBgColor="FFFFFF" canvasBgRatio="0" canvasBorderAlpha="0" chartBottomMargin="20" chartLeftMargin="3" chartRightMargin="36" chartTopMargin="13" divLineColor="999999" forceDecimals="0" forceYAxisValueDecimals="0" formatNumberScale="1" labelDisplay="" legendBgAlpha="0" legendBorderAlpha="0" numberPrefix="$" numberSuffix="" outCnvBaseFontColor="FFFFFF" placeValuesInside="1" plotColor="FF00BB" plotFillAlpha="100" plotFillRatio="100" rotateLabels="" rotateValues="" showAboutMenuItem="1" showBorder="0" showExportDataMenuItem="" showLabels="" showLegend="0" showLimits="" showValues="" showYAxisValues="0" slantLabels="" toolTipBgColor="000000" toolTipBorder="FFFFFF" toolTipFontColor="FF00BB" toolTipSepChar="" yAxisName="" yAxisValueDecimals="0">
	<categories>
		<category Label="Budget"/>
		<category Label="Actual"/>
	</categories>
	<dataset>
		<set color="EB0C81" toolText="" value="275000.0000"/>
		<set color="099015" toolText="" value="290000.0000"/>
	</dataset>
	<trendLines/>
	<styles>
		<definition>
			<style bgColor="000000" borderColor="666666" color="FFFFFF" font="Verdana" name="TTipFont" size="10" type="font"/>
		</definition>
		<application>
			<apply styles="TTipFont" toObject="TOOLTIP"/>
		</application>
	</styles>
	<ChartTitle chart_title="Media Spend"/>
</chart>
We do have a more recent version of the charts for our new website. However, we're keeping the old one up during the transition. Until that's over, I need to continue supporting the old one. And, as I mentioned previously, this works fine in browsers other than Firefox.
Any thoughts?
Thanks in advance,
Emilio -
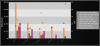
I started seeing this in Firefox version 49.0.1, and am now also seeing it in 49.0.2. The Flash chart backgrounds are not transparent.
I've attached screenshots of how our charts look on both Firefox and Chrome.
Flash version is 23.0.0.185.
Know what might be causing this?
Thanks,
Emilio
-
Hello,
I'm working on an ASP.NET site that contains FusionChart (v 3.10.1) charts with the exportEnabled option set to true, and using the export.api3 URL to handle the image processing. However, whenever a user clicks on the button to save the image the page reloads/refreshes in addition to the image being saved.
I know less about the HTML side than the code-behind, but the best I can tell is that a form on the page contains a default postback method with the page's URL, and that's being called when the export is executed. Is this common? Is there a way to fix this, from either the chart's end or the form's end? The form, by the way, is used to contain a couple of asp elements.
Any insights would be most appreciated.
Emilio
-
Thank you. That worked perfectly.
-Emilio
-
Is it possible to have the tool-tip value shown without rounding?
Here's the XML for the chart (using MSCombiDY2D.swf)
<chart showBorder="0" adjustDiv="1" alternateHGridColor="FFFFFF" animation="1" baseFont="" baseFontColor="" baseFontSize="" bgAlpha="0" bgColor="0" borderColor="FFFFFF" canvasBorderAlpha="10" canvasBorderThickness="1" canvasPadding="0"chartBottomMargin="0" chartLeftMargin="0" chartRightMargin="0" chartTopMargin="20" Decimals="0" divLineColor="CCCCCC" divLineDecimalPrecision="1" FAKECategoryFormat="" forceDecimals="0" forceSYAxisValueDecimals="0"forceYAxisValueDecimals="0" formatNumberScale="0" labelDisplay="ROTATE" labelPadding="" legendBgAlpha="" legendBorderAlpha="" legendNumColumns="1" legendPadding="" legendPosition="right" limitsDecimalPrecision="1"minimiseWrappingInLegend="1" numberPrefix="" numberSuffix="" outCnvBaseFont="" outCnvBaseFontColor="000000" outCnvBaseFontSize="" palletteColors="" pFormatNumberScale="" plotFillAlpha="100" plotFillAngle="90" plotGradientColor=""PYAxisMaxValue="" PYAxisMinValue="" PYAxisName="" rotateLabels="" SAxisMaxValue="" sDecimals="0" sFormatNumberScale="" showDivLineSecondaryValue="1" showDivLineValues="0" showExportDataMenuItem="" showLegend="0" showLimits="0"showPlotBorder="0" showSecondaryLimits="1" showValues="1" sNumberPrefix="" sNumberSuffix="" SYAxisMinValue="" SYAxisName="Calls" useEllipsesWhenOverflow="" useRoundEdges="" yAxisValueDecimals="0"><categories font="Arial" fontColor="439EAA"><category label="9/2"/><category label="9/9"/><category label="9/16"/><category label="9/23"/><category label="9/30"/><category label="10/7"/><category label="10/14"/><category label="10/21"/><category label="10/28"/><category label="11/4"/><category label="11/11"/><category label="11/18"/><category label="11/25"/><category label="12/2"/><category label="12/9"/><category label="12/16"/><category label="12/23"/><category label="12/30"/><category label="1/6"/><category label="1/13"/></categories><dataset showValues="0" color="4CA8B5" seriesname="" parentYAxis="" alpha="1" FAKEDisplayFormat=""><set showValues="0" Color=""/><set showValues="0" Color=""/><set showValues="0" Color=""/><set showValues="0" Color=""/><set showValues="0" Color=""/><set showValues="0" Color=""/><set showValues="0" Color=""/><set showValues="0" Color=""/><set showValues="0" Color=""/><set showValues="0" Color=""/><set showValues="0" Color=""/><set showValues="0" Color=""/><set showValues="0" Color=""/><set showValues="0" Color=""/><set showValues="0" Color=""/><set showValues="0" Color=""/><set showValues="0" Color=""/><set showValues="0" Color=""/><set showValues="0" Color=""/><set showValues="0" Color=""/></dataset><dataset borderColor="FFFFFF" showValues="0" color="1233AC" seriesname="Actual" parentYAxis="S" Thickness="4" anchorBgColor="1233AC" anchorBorderThickness="4" lineThickness="4" alpha="100" FAKEDisplayFormat="" slantLabels=""><set showValues="0" displayValue="$5216" value="5216.0000" Color=""/><set showValues="0" displayValue="$3531" value="3531.0000" Color=""/><set showValues="0" displayValue="$2782" value="2782.0000" Color=""/><set showValues="0" displayValue="$3522" value="3522.0000" Color=""/><set showValues="0" displayValue="$4594" value="4594.0000" Color=""/><set showValues="0" displayValue="$4287" value="4287.0000" Color=""/><set showValues="0" displayValue="$3744" value="3744.0000" Color=""/><set showValues="0" displayValue="$3002" value="3002.0000" Color=""/><set showValues="0" displayValue="$3176" value="3176.0000" Color=""/><set showValues="0" displayValue="$2387" value="2387.0000" Color=""/><set showValues="0" displayValue="$1563" value="1563.0000" Color=""/><set showValues="0" displayValue="$1283" value="1283.0000" Color=""/><set showValues="0" displayValue="$1906" value="1906.0000" Color=""/><set showValues="0" displayValue="$1605" value="1605.0000" Color=""/><set showValues="0" displayValue="$810" value="810.0000" Color=""/><set showValues="0" displayValue="$1378" value="1378.0000" Color=""/><set showValues="0" displayValue="$3172" value="3172.0000" Color=""/><set showValues="0" displayValue="$8189" value="8189.0000" Color=""/><set showValues="0" displayValue="$3967" value="3967.0000" Color=""/><set showValues="0" displayValue="$2579" value="2579.0000" Color=""/></dataset><dataset borderColor="FFFFFF" showValues="0" color="8F1822" seriesname="Forecast" parentYAxis="S" Thickness="4" anchorBgColor="8F1822" anchorBorderThickness="4" lineThickness="4" alpha="100" FAKEDisplayFormat="#,###" slantLabels=""><set showValues="0" displayValue="2,275" value="2275.0000" Color=""/><set showValues="0" displayValue="1,950" value="1950.0000" Color=""/><set showValues="0" displayValue="1,950" value="1950.0000" Color=""/><set showValues="0" displayValue="1,950" value="1950.0000" Color=""/><set showValues="0" displayValue="1,950" value="1950.0000" Color=""/><set showValues="0" displayValue="1,950" value="1950.0000" Color=""/><set showValues="0" displayValue="1,950" value="1950.0000" Color=""/><set showValues="0" displayValue="1,950" value="1950.0000" Color=""/><set showValues="0" displayValue="1,950" value="1950.0000" Color=""/><set showValues="0" displayValue="1,950" value="1950.0000" Color=""/><set showValues="0" displayValue="1,950" value="1950.0000" Color=""/><set showValues="0" displayValue="1,950" value="1950.0000" Color=""/><set showValues="0" displayValue="1,950" value="1950.0000" Color=""/><set showValues="0" displayValue="2,075" value="2075.0000" Color=""/><set showValues="0" displayValue="2,075" value="2075.0000" Color=""/><set showValues="0" displayValue="2,350" value="2350.0000" Color=""/><set showValues="0" displayValue="3,650" value="3650.0000" Color=""/><set showValues="0" displayValue="5,200" value="5200.0000" Color=""/><set showValues="0" displayValue="3,900" value="3900.0000" Color=""/><set showValues="0" displayValue="3,250" value="3250.0000" Color=""/></dataset><trendLines/><ChartTitle chart_title="Forecast vs. Total Actions"/></chart>Thanks,
Emilio
-
Folks, sorry for the false alarm.
We found that the problem was with a setting on our site that forced IE into an earlier version.
Emilio
-
Hello,
We recently downloaded and applied the latest version of FusionCharts to our site, but we're still not able to get it to render on a new Windows phone, which I believe has IE 9 loaded. I noticed that your demo gallery renders perfectly from this same platform/device. However, you don't list it on your compatibility list.
Do you have any insights for us?
Thanks,
Emilio
-
Hello Angshu,
This service release appears a little newer than what we are currently using (3.2.2-release.3880). I'm hoping to update our current version so that our charts show up on the latest IE mobile browser. It's not working with our version. However, your demo gallery works with the latest IE mobile browser, so that makes me think we just need to get the latest version. Is this a safe assumption to make?
Much appreciated,
Emilio
Hi,
Welcome to FusionCharts Forum!

Please find the latest SR1 JS files attached for your reference.
You would need to copy these JS files in your charts folder.
Hope this helps.
-
Hello FusionCharts,
I'm just wondering if my last post makes sense, and if this is something that can be made available in a later version.
Thanks,
Emilio
Thanks, Sanjukta. That certainly helps me understand the behavior.
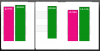
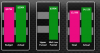
In case it wasn't clear, what I'm wanting to do can be seen in the two attachments. One shows how data is currently rendered, the other shows how I'd like it to show (via a graphically-edited chart). I think when these dots don't overlap, they're much more detectable and readable. If this is not available now, and it sounds like it isn't, can it be available in a later version?
Thanks,
Emilio
-
Thanks, Sanjukta. That certainly helps me understand the behavior.
In case it wasn't clear, what I'm wanting to do can be seen in the two attachments. One shows how data is currently rendered, the other shows how I'd like it to show (via a graphically-edited chart). I think when these dots don't overlap, they're much more detectable and readable. If this is not available now, and it sounds like it isn't, can it be available in a later version?
Thanks,
Emilio
-
Well, each group has several bars representing different day parts. The line dots also correspond to different day parts, but they're all gathered on the first bar. Does this clarify it?
Thanks,
Emilio
-
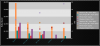
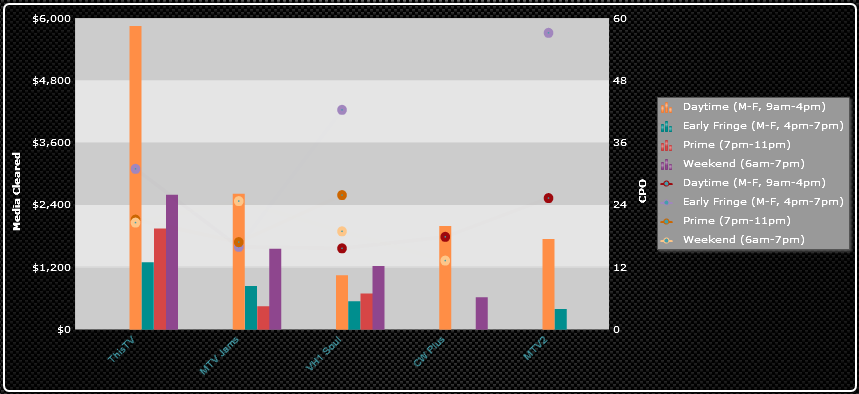
Hello FusionCharts,
I've created the following chart that correctly shows me various bars, but groups all the dots on the first bar. Please see attached screenshot. I'm also including the XML.
Is there a way to have the dots line up with the various bars?
Thanks,
Emilio
-
Do you make a stand-alone Legend that doesn't need to be part of a chart?
Thanks,
Emilio


Cannot read property 'chartContainer' of undefined
in Installation and Upgrades
Posted · Report reply
Hello,
I'm attempting to upgrade from 3.10.1 to 3.13.3 and am encountering this error with the new charts.
Uncaught TypeError: Cannot read property 'chartContainer' of undefined
at FusionCharts._addChartDependency (fusioncharts.js:4954)
at trackVisibility (fusioncharts.js:3050)
How would you advise I go about trying to figure out where the error is? I wouldn't be able to send you my ASP.NET app. It was working without error in version 3.10.1. One thing that occurred to me is that we drop the active collection and then get new charts when the user traverses a date range. Could that be the issue? Are the new charts sensitive to being removed?
Thanks,
Emilio