
a_goodgirl
-
Content count
25 -
Joined
-
Last visited
Posts posted by a_goodgirl
-
-
Hello!
Attributes "thousandSeparator" and "thousandSeparatorPosition" specifies the properties of both axes. How to set the thousand separator for the x-axis and y-axis separately?
Thanks!
-
It's sad that FusionСharts loses its functionality instead of develop ..

-
Thanks for the answer! But there is a problem:
I want to set the properties for the "tasks".

Previously, using the style TASKLABELS or TASKDATELABELS for the Font Style Type we can be set the following basic attributes:"font", "size", "color", "bold", "italic", "underline", "bgColor".
Now for "tasks" (or "task") can be set "font", "fontColor", "fontSize".
How to set "bold", "italic" and other attributes?
-
Hi!
Styles TASKLABELS and TASKDATELABELS does not work in Gantt chart.
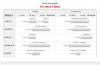
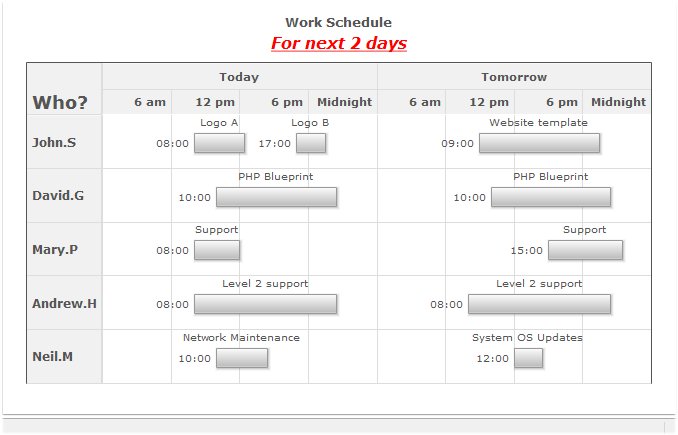
Consider the demo example (see Chart gallery) "Gantt Chart with both date and time". Add styles TASKLABELS, TASKDATELABELS and SUBCAPTION:
<chart dateformat="mm/dd/yyyy" outputdateformat="hh:mn" caption="Work Schedule" subcaption="For next 2 days" showborder="0">
<categories>
<category start="7/15/2007 00:00:00" end="7/15/2007 23:59:59" label="Today" />
<category start="7/16/2007 00:00:00" end="7/16/2007 23:59:59" label="Tomorrow" />
</categories>
<categories align="right">
<category start="7/15/2007 00:00:00" end="7/15/2007 05:59:59" label="6 am" />
<category start="7/15/2007 06:00:00" end="7/15/2007 11:59:59" label="12 pm" />
<category start="7/15/2007 12:00:00" end="7/15/2007 17:59:59" label="6 pm" />
<category start="7/15/2007 18:00:00" end="7/15/2007 23:59:59" label="Midnight" />
<category start="7/16/2007 00:00:00" end="7/16/2007 05:59:59" label="6 am" />
<category start="7/16/2007 06:00:00" end="7/16/2007 11:59:59" label="12 pm" />
<category start="7/16/2007 12:00:00" end="7/16/2007 17:59:59" label="6 pm" />
<category start="7/16/2007 18:00:00" end="7/16/2007 23:59:59" label="Midnight" />
</categories>
<processes fontsize="12" isbold="1" align="left" headertext="Who?" headerfontsize="18" headervalign="bottom" headeralign="left">
<process label="John.S" id="EMP121" />
<process label="David.G" id="EMP122" />
<process label="Mary.P" id="EMP123" />
<process label="Andrew.H" id="EMP124" />
<process label="Neil.M" id="EMP125" />
</processes>
<tasks showlabels="1" showstartdate="1">
<task processid="EMP121" start="7/15/2007 08:00:00" end="7/15/2007 12:30:00" label="Logo A" />
<task processid="EMP121" start="7/15/2007 17:00:00" end="7/15/2007 19:30:00" label="Logo B" />
<task processid="EMP121" start="7/16/2007 09:00:00" end="7/16/2007 19:30:00" label="Website template" />
<task processid="EMP122" start="7/15/2007 10:00:00" end="7/15/2007 20:30:00" label="PHP Blueprint" />
<task processid="EMP122" start="7/16/2007 10:00:00" end="7/16/2007 20:30:00" label="PHP Blueprint" />
<task processid="EMP123" start="7/15/2007 08:00:00" end="7/15/2007 12:00:00" label="Support" />
<task processid="EMP123" start="7/16/2007 15:00:00" end="7/16/2007 21:30:00" label="Support" />
<task processid="EMP124" start="7/15/2007 08:00:00" end="7/15/2007 20:30:00" label="Level 2 support" />
<task processid="EMP124" start="7/16/2007 08:00:00" end="7/16/2007 20:30:00" label="Level 2 support" />
<task processid="EMP125" start="7/15/2007 10:00:00" end="7/15/2007 14:30:00" label="Network Maintenance" />
<task processid="EMP125" start="7/16/2007 12:00:00" end="7/16/2007 14:30:00" label="System OS Updates" />
</tasks>
<styles>
<definition>
<style name="myFont" type="font" size="16" color="ff0000" bold="1" italic="1" underline="1"/>
</definition>
<application>
<apply toObject="TASKLABELS" styles="myFont"/>
<apply toObject="TASKDATELABELS" styles="myFont"/>
<apply toObject="SUBCAPTION" styles="myFont"/>
</application>
</styles>
</chart>
Styles TASKLABELS and TASKDATELABELS are ignored, however, the same style SUBCAPTION applies:
-
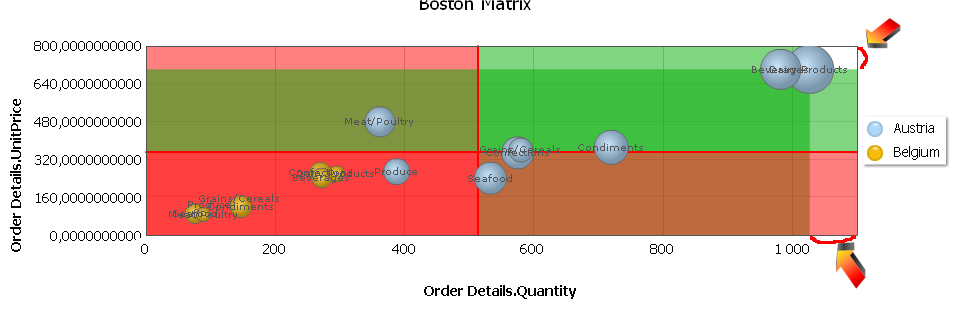
Hello! I want to set the style QUADRANTLABELS for Bubble Chart. It does not apply. The same parameters in style DATAVALUES works well.
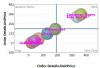
<chart formatNumberScale="0" legendBorderAlpha="0" divLineThickness="1" quadrantYVal="191.25" bgColor="ffffff" quadrantLabelTL="Question Marks" thousandSeparator=" " canvasbgColor="ffffff" useEllipsesWhenOverflow="1" drawQuadrant="1" yAxisMinValue="-100" quadrantLabelTR="Stars" animation="0" yAxisMaxValue="482.5" quadrantXVal="191.25" aboutMenuItemLink="n-http://www.contourcomponents.ru" canvasBgAlpha="100" showAlternateHGridColor="0" toolTipSepChar=": " formatNumber="1" showYAxisValues="1" forceDecimals="1" rotateValues="0" labelDisplay="AUTO" quadrantLabelBL="Dogs" divLineColor="b1b1b1" plotGradientColor="" showLabels="1" quadrantLabelBR="Cash Cows" showToolTip="1" legendScrollBgColor="ffffff" plotBorderColor="3c3c3c" numDivLines="4" xAxisName="Order Details.UnitPrice" xAxisMinValue="-97.125" divLineIsDashed="0" showLegend="0" showZeroPlane="0" quadrantLineColor="4f81bd" aboutMenuItemLabel="About Contour BI" legendPosition="BOTTOM" is3D="0" adjustDiv="0" placeValuesInside="0" quadrantLineThickness="4" legendScrollBtnColor="c3d3fd" plotBorderThickness="1" canvasBorderThickness="1" xAxisMaxValue="479.625" showZeroPlaneValue="0" plotBorderDashed="0" plotBorderAlpha="100" decimalSeparator="," yAxisName="Order Details.UnitPrice" showBorder="0" showPlotBorder="1" legendScrollBarColor="c3d3fd" showValues="1" bgAlpha="100" bubbleScale="1" decimals="0" xAxisNamePadding="30"><vTrendlines><line isTrendZone="1" showOnTop="1" alpha="20" displayValue=" " color="ffffff" startValue="-97.125" endValue="191.25"/><line isTrendZone="1" showOnTop="1" alpha="20" displayValue=" " color="ffffff" startValue="191.25" endValue="479.625"/></vTrendlines><categories><category x="0" label="0"/><category x="100" label="100"/><category x="200" label="200"/><category x="300" label="300"/><category x="400" label="400"/></categories><trendlines><line isTrendZone="1" valueOnRight="1" alpha="20" displayValue=" " color="ffffff" startValue="-100" endValue="191.25"/><line isTrendZone="1" valueOnRight="1" alpha="20" displayValue=" " color="ffffff" startValue="191.25" endValue="482.5"/></trendlines><dataset seriesName="Order Details.UnitPrice"><set x="335.4" y="335.4" z="100" tooltext="Alice Mutton" displayValue="Alice Mutton" link="internal://n-#cell,0,0" name="Alice Mutton" color="b3daf8"/><set x="20" y="20" z="100" tooltext="Aniseed Syrup" displayValue="Aniseed Syrup" link="internal://n-#cell,1,0" name="Aniseed Syrup" color="f6c11d"/><set x="362.5" y="362.5" z="100" tooltext="Carnarvon Tigers" displayValue="Carnarvon Tigers" link="internal://n-#cell,2,0" name="Carnarvon Tigers" color="92be0f"/><set x="68.4" y="68.4" z="100" tooltext="Chai" displayValue="Chai" link="internal://n-#cell,3,0" name="Chai" color="ff9451"/><set x="129.2" y="129.2" z="100" tooltext="Chang" displayValue="Chang" link="internal://n-#cell,4,0" name="Chang" color="0f9494"/><set x="22.95" y="22.95" z="100" tooltext="Chocolade" displayValue="Chocolade" link="internal://n-#cell,5,0" name="Chocolade" color="d85151"/><set x="42" y="42" z="100" tooltext="Filo Mix" displayValue="Filo Mix" link="internal://n-#cell,6,0" name="Filo Mix" color="945194"/><set x="184.9" y="184.9" z="100" tooltext="Flotemysost" displayValue="Flotemysost" link="internal://n-#cell,7,0" name="Flotemysost" color="628c33"/></dataset><styles><definition><style size="14" type="font" name="LegendFont" color="000000" font="tahoma"/><style size="15" type="font" name="AxisXFont" color="000000" font="tahoma"/><style size="14" type="font" name="ScaleXFont" color="000000" font="tahoma"/><style size="14" type="font" name="AxisYFont" color="000000" font="tahoma"/><style size="14" type="font" name="ScaleYFont" color="000000" font="tahoma"/><style size="16" bold="1" type="font" underline="0" name="MarksFont" color="ff00ff" font="Comic Sans MS" italic="0"/><style size="11" type="font" name="ToolTipFont" color="555555" font="tahoma"/><style size="16" bold="1" type="font" underline="0" name="BostonMatrixFont" color="ff00ff" font="Comic Sans MS" italic="0"/><style size="8" type="font" name="BostonMatrixTrendlineFont" bgColor="ffffff" color="000000" font="tahoma"/></definition><application><apply styles="LegendFont" toObject="LEGEND"/><apply styles="AxisXFont" toObject="XAXISNAME"/><apply styles="ScaleXFont" toObject="DATALABELS"/><apply styles="AxisYFont" toObject="YAXISNAME"/><apply styles="ScaleYFont" toObject="YAXISVALUES"/><apply styles="MarksFont" toObject="DATAVALUES"/><apply styles="ToolTipFont" toObject="TOOLTIP"/><apply styles="BostonMatrixFont" toObject="QUADRANTLABELS"/><apply styles="BostonMatrixTrendlineFont" toObject="VTRENDVALUES"/></application></styles></chart>
-
yes, but in the same case, part of style is applied ("XAXISNAME", "YAXISNAME", "DATAVALUES"), part no ("SUBCAPTION", "DATALABELS","YAXISVALUES" ). Maybe FusionCharts programmers should write all the same?
-
Hello!
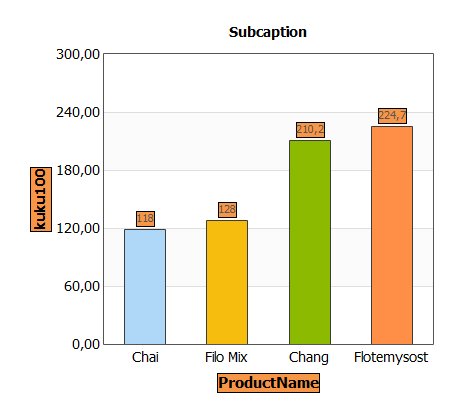
Set the same parameters "borderColor" and "bgColor" for styles "XAXISNAME", "DATALABELS", "SUBCAPTION", "YAXISNAME", "YAXISVALUES", "DATAVALUES". However, for the subcaption, labels and y-axis values background and frame not visible:

xml text:
<chart formatNumberScale="0" legendBorderAlpha="0" thousandSeparatorPosition="100" divLineThickness="1" bgColor="ffffff" thousandSeparator=" " alternateHGridAlpha="50" canvasbgColor="ffffff" useEllipsesWhenOverflow="1" animation="0" alternateHGridColor="f7f7f7" aboutMenuItemLink="n-http://www.contourcomponents.ru" canvasBgAlpha="100" showAlternateHGridColor="1" toolTipSepChar=": " formatNumber="1" showYAxisValues="1" forceDecimals="1" rotateValues="0" labelDisplay="AUTO" divLineColor="b1b1b1" plotGradientColor="" useRoundEdges="0" showLabels="1" showToolTip="1" legendScrollBgColor="ffffff" plotBorderColor="3c3c3c" xAxisName="ProductName - ShipCountry" subcaption="Subcaption" setAdaptiveYMin="1" divLineIsDashed="0" aboutMenuItemLabel="About Contour BI" legendPosition="BOTTOM" placeValuesInside="0" legendScrollBtnColor="c3d3fd" plotBorderThickness="1" canvasBorderThickness="1" plotBorderDashed="0" plotSpacePercent="50" plotBorderAlpha="100" decimalSeparator="," yAxisName="kuku100" showBorder="0" showPlotBorder="1" legendScrollBarColor="c3d3fd" showValues="1" bgAlpha="100" decimals="2"><set displayValue="118" value="118" link="internal://n-#cell,0,0" label="Chai
Brazil"/><set displayValue="110,2" value="110.20000000000000284" link="internal://n-#cell,1,0" label="Chocolade
Austria"/><set displayValue="112,75" value="112.75" link="internal://n-#cell,2,0" label="Brazil"/><set displayValue="128" value="128" link="internal://n-#cell,3,0" label="Filo Mix"/><set displayValue="134,2" value="134.19999999999998863" link="internal://n-#cell,4,0" label="Chang
Austria"/><set displayValue="176" value="176" link="internal://n-#cell,5,0" label="Brazil"/><set displayValue="160,2" value="160.19999999999998863" link="internal://n-#cell,6,0" label="Flotemysost"/><set displayValue="164,5" value="164.5" link="internal://n-#cell,7,0" label="Austria"/><styles><definition><style size="14" borderColor="000000" type="font" name="LegendFont" bgColor="f79646" color="000000" font="tahoma"/><style size="15" borderColor="000000" type="font" name="AxisXFont" bgColor="f79646" color="000000" font="tahoma"/><style size="14" borderColor="000000" type="font" name="ScaleXFont" bgColor="f79646" color="000000" font="tahoma"/><style size="14" borderColor="000000" type="font" name="Subcaption" bgColor="f79646" color="000000" font="tahoma"/><style size="14" borderColor="000000" type="font" name="AxisYFont" bgColor="f79646" color="000000" font="tahoma"/><style size="14" borderColor="000000" type="font" name="ScaleYFont" bgColor="f79646" color="000000" font="tahoma"/><style size="11" borderColor="000000" bold="0" type="font" underline="0" name="MarksFont" bgColor="f79646" color="555555" font="tahoma" italic="0"/><style size="11" borderColor="000000" type="font" name="ToolTipFont" bgColor="f79646" color="555555" font="tahoma"/></definition><application><apply styles="LegendFont" toObject="LEGEND"/><apply styles="AxisXFont" toObject="XAXISNAME"/><apply styles="ScaleXFont" toObject="DATALABELS"/><apply styles="Subcaption" toObject="SUBCAPTION"/><apply styles="AxisYFont" toObject="YAXISNAME"/><apply styles="ScaleYFont" toObject="YAXISVALUES"/><apply styles="MarksFont" toObject="DATAVALUES"/><apply styles="ToolTipFont" toObject="TOOLTIP"/></application></styles></chart>
Thank you!
-
Hello!
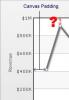
Property "canvasPadding" set the space between the canvas border and first & last data points.
How to set this space (between the canvas border and first & last data points) on the Y axis in pixels (without using yAxisMinValue and yAxisMaxValue)?
-
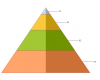
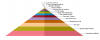
Hello!
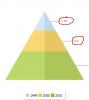
I set "plotBorderThickness=10" in the pyramid chart type. But the border is drawn by a thin line. What is wrong?
Thanks.
<chart formatNumberScale="0" legendBorderAlpha="0" bgColor="ffffff" thousandSeparator=" " canvasbgColor="ffffff" useEllipsesWhenOverflow="1" animation="0" showPercentValues="0" aboutMenuItemLink="n-http://www.contourcomponents.ru" showShadow="0" isSliced="0" pyramidYScale="40" toolTipSepChar=": " formatNumber="1" forceDecimals="1" showYAxisValues="0" rotateValues="0" labelDisplay="AUTO" plotGradientColor="" is2D="1" showLabels="1" showToolTip="1" plotBorderColor="ff0000" xAxisName="Products.ProductName" setAdaptiveYMin="1" showLegend="0" plotfillAlpha="100" aboutMenuItemLabel="About Contour BI" showLabelsAtCenter="0" placeValuesInside="0" plotBorderThickness="10" canvasBorderThickness="1" plotBorderAlpha="100" showPercentInToolTip="0" decimalSeparator="," yAxisName="Quantity" showBorder="0" showPlotBorder="1" showValues="0" bgAlpha="100" decimals="0"><set toolText="Gumbär Gummibärchen: 21" displayValue="21" value="21" link="internal://n-#cell,0,0" label="21"/><set toolText="Chang: 50" displayValue="50" value="50" link="internal://n-#cell,0,1" label="50"/><set toolText="Chef Anton's Gumbo Mix: 65" displayValue="65" value="65" link="internal://n-#cell,0,2" label="65"/><set toolText="Chocolade: 70" displayValue="70" value="70" link="internal://n-#cell,0,3" label="70"/><styles><definition><style size="11" type="font" name="MarksFont" color="555555" font="tahoma"/><style size="11" type="font" name="ToolTipFont" color="555555" font="tahoma"/></definition><application><apply styles="MarksFont" toObject="DATALABELS"/><apply styles="ToolTipFont" toObject="TOOLTIP"/></application></styles></chart>
-
Hi! The forum discussed the problem of vertical scrolling of Chart Gantt for many years. The first mention I have seen since 2008. It was a promise "Vertical Scroll in Gantt charts is an update planned for v4 of FusionWidgets, which is scheduled for sometime around end 2009."( http://forum.fusionc...on-gantt-charts )
There is a possibility of vertical scrolling Gantt chart? Without vertical scrolling this chart does not make sense! Users work with real data, not with 5 values like in your examples.
Here is the chart without scrolling with only 20 lines for now:
-
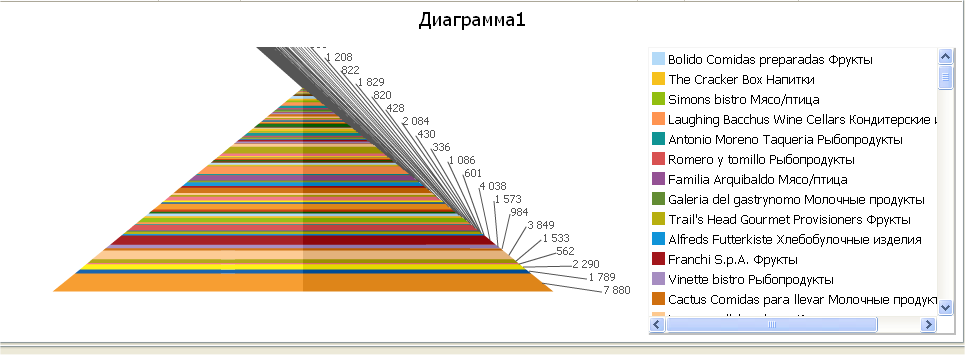
Too many labels, increasing the height would not work. I think labels can cover each other, but they must not go beyond the bounds of the window. Example for testing:
<chart formatNumberScale="0" legendBorderAlpha="0" numberSuffix="%" bgColor="ffffff" thousandSeparator=" " canvasbgColor="ffffff" useEllipsesWhenOverflow="1" animation="0" showPercentValues="0" aboutMenuItemLink="n-http://www.contourcomponents.ru" showShadow="0" isSliced="0" pyramidYScale="40" toolTipSepChar=": " formatNumber="1" forceDecimals="1" showYAxisValues="0" rotateValues="0" labelDisplay="AUTO" legendBgColor="ffffff" is2D="1" rotateLabels="0" showLabels="1" showToolTip="1" legendScrollBgColor="ffffff" xAxisName="Название клиента" setAdaptiveYMin="1" plotfillAlpha="100" aboutMenuItemLabel="About Contour BI" showLabelsAtCenter="0" legendPosition="RIGHT" placeValuesInside="0" legendScrollBtnColor="c3d3fd" canvasBorderThickness="1" showPercentInToolTip="0" decimalSeparator="," yAxisName="Количество" showBorder="0" legendScrollBarColor="c3d3fd" showValues="0" bgAlpha="100" decimals="0">
<set toolText="Ana Trujillo Emparelados: 28" displayValue="Ana Trujillo Emparelados" value="28" link="n-#cell,0,0" label="Ana Trujillo Emparelados"/>
<set toolText="Bolido Comidas preparadas: 40" displayValue="Bolido Comidas preparadas" value="40" link="n-#cell,1,0" label="Bolido Comidas preparadas"/>
<set toolText="Consolidated Holdings: 54" displayValue="Consolidated Holdings" value="54" link="n-#cell,2,0" label="Consolidated Holdings"/>
<set toolText="Cactus Comidas para llevar: 77" displayValue="Cactus Comidas para llevar" value="77" link="n-#cell,3,0" label="Cactus Comidas para llevar"/>
<set toolText="Alfreds Futterkiste: 78" displayValue="Alfreds Futterkiste" value="78" link="n-#cell,4,0" label="Alfreds Futterkiste"/>
<set toolText="Comercio Mineiro: 88" displayValue="Comercio Mineiro" value="88" link="n-#cell,5,0" label="Comercio Mineiro"/>
<set toolText="Antonio Moreno Taqueria: 128" displayValue="Antonio Moreno Taqueria" value="128" link="n-#cell,6,0" label="Antonio Moreno Taqueria"/>
<set toolText="B's Beverages: 177" displayValue="B's Beverages" value="177" link="n-#cell,7,0" label="B's Beverages"/>
<set toolText="Blauer See Delikatessen: 242" displayValue="Blauer See Delikatessen" value="242" link="n-#cell,8,0" label="Blauer See Delikatessen"/>
<set toolText="Die Wandernde Kuh: 312" displayValue="Die Wandernde Kuh" value="312" link="n-#cell,9,0" label="Die Wandernde Kuh"/>
<set toolText="Chop-suey Chinese: 331" displayValue="Chop-suey Chinese" value="331" link="n-#cell,10,0" label="Chop-suey Chinese"/>
<set toolText="Around the Horn: 448" displayValue="Around the Horn" value="448" link="n-#cell,11,0" label="Around the Horn"/>
<set toolText="Blondel pere et fils: 475" displayValue="Blondel pere et fils" value="475" link="n-#cell,12,0" label="Blondel pere et fils"/>
<set toolText="Bon app': 627" displayValue="Bon app'" value="627" link="n-#cell,13,0" label="Bon app'"/>
<set toolText="Bottom-Dollar Markets: 703" displayValue="Bottom-Dollar Markets" value="703" link="n-#cell,14,0" label="Bottom-Dollar Markets"/>
<set toolText="Berglunds snabbkop: 856" displayValue="Berglunds snabbkop" value="856" link="n-#cell,15,0" label="Berglunds snabbkop"/>
<styles>
<definition>
<style size="14" type="font" name="LegendFont" color="000000" font="Tahoma"/>
<style size="11" type="font" name="MarksFont" color="000000" font="Tahoma"/>
<style size="11" type="font" name="ToolTipFont" bgColor="ffffff" color="000000" font="Tahoma"/>
</definition>
<application>
<apply styles="LegendFont" toObject="LEGEND"/>
<apply styles="MarksFont" toObject="DATALABELS"/>
<apply styles="ToolTipFont" toObject="TOOLTIP"/>
</application>
</styles>
</chart>
-
Thanks for the help!
-
Hi! The chart pyramid lables outside the window frame. Is there an attribute (like "manageLabelOverflow" for Pie) to properly display labels?

-
Hi!
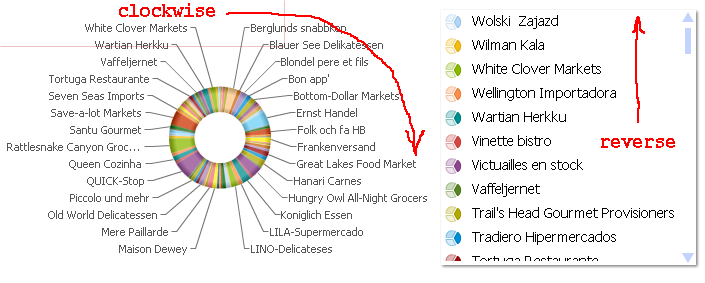
I would like to place the values of Pie chart as Excel - starting from zero degrees and clockwise (so familiar to users). The angle can be set by "startingAngle". How to change the order of the values? I tried to set a list of items <set> in reverse order. With the pie is good, but then, too, the legend is displayed in reverse. Is there a solution to this issue?
-
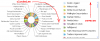
Hello! I want to plot Boston Matrix with bubble chart.
I calculate the minimum and maximum of the data and draw quadrant (attributes "drawQuadrant"=1 , "quadrantXVal"=(min+max)/2., etc.)
Now I need to paint sectors a different color. I use 2 trendlines ("isTrendZone" = 1), "startValue"=min, "endValue"=(min+max)/2. and "startValue"=(min+max)/2., "endValue"=max
But the plot gets out beyond the minimum and maximum.
Can I paint over sectors in the right way? Or it may be a different type of graph (not bubble)?
Thanks
-
You helped me! Thanks
-
Hello! Here's the Pyramid chart:
 <chart toolTipSepChar=": " rotateLabels="0" decimals="0" animation="0" showPercentValues="0" setAdaptiveYMin="1"
legendScrollBarColor="c3d3fd" forceDecimals="1" labelDisplay="AUTO" showValues="0" legendScrollBtnColor="c3d3fd"
canvasBorderThickness="1" decimalSeparator="," formatNumber="1" canvasbgColor="ffffff" isSliced="0"
showShadow="0" bgAlpha="100" plotfillAlpha="64" thousandSeparator=" " showYAxisValues="0" showBorder="0"
formatNumberScale="0" legendPosition="BOTTOM" legendScrollBgColor="ffffff" legendBgColor="ffffff"
aboutMenuItemLabel="About Contour BI" aboutMenuItemLink="n-http://www.contourcomponents.ru"
bgColor="ffffff" showLabels="0" xAxisName="Год" legendBorderAlpha="0" showLabelsAtCenter="0"
showPercentInToolTip="0" is2D="1" pyramidYScale="40" yAxisName="Минимальная цена">

<set toolText="1999: 9.52097" displayValue="10" value="9.52097" label="10"/>
<set toolText="2000: 10.277" displayValue="10" value="10.277" label="10"/>
<set toolText="2001: 14.1893" displayValue="14" value="14.1893" label="14"/>

<styles>
<definition><style size="14" type="font" name="LegendFont" color="000000" font="Tahoma"/>
</definition>
<application>
<apply styles="LegendFont" toObject="LEGEND"/
</application>
</styles>
</chart>
I set
showLabels="0"
and
showValues="0"
but labels is visible. Where the error? How to make the labels invisible?
Thanks
-
Thank you!
-
Thanks, if you use
<vLine color='...' thickness='...' />
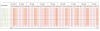
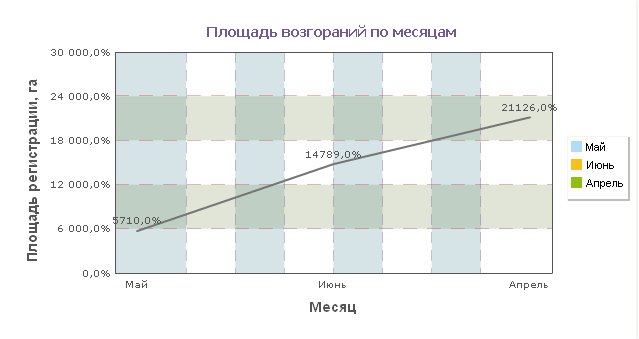
the vertical lines are visible. But do not see an vertical alternative color! Although showAlternateVGridColor=1 and alternateVGridColor is defined. But if the property "numVDivLines" is set alternative color is visible.
Question: how to make a visible vertical alternative color, not setting the property numVDivLines ?
<chart formatNumberScale="0" legendBorderAlpha="0" showPrintMenuItem="1" numberSuffix="%"
divLineThickness="1" bgColor="ffffff" thousandSeparator=" " alternateHGridAlpha="20"
canvasbgColor="ffffff" anchorAlpha="0" animation="0" alternateHGridColor="687e3c"
aboutMenuItemLink="n-http://www.contourcomponents.ru" vDivlineDashGap="7" showShadow="0"
showAlternateHGridColor="1" toolTipSepChar=": " formatNumber="1" showYAxisValues="1"
forceDecimals="1" divLineColor="c0504d" legendBgColor="ffffff" showLabels="1"
legendScrollBgColor="ffffff" lineThickness="2" alternateVGridColor="337a85" xAxisName="Месяц"
vDivlineColor="8064a2" divLineDashGap="10" divLineIsDashed="1" aboutMenuItemLabel="About Contour BI"
legendPosition="RIGHT" vDivlineDashLen="11" alternateVGridAlpha="20" dashed="1" vDivlineThickness="1"
legendScrollBtnColor="c3d3fd" canvasBorderThickness="1" divLineDashLen="14" caption="Площадь возгораний по месяцам"
decimalSeparator="," yAxisName="Площадь регистрации, га" vDivLineisDashed="1" showBorder="0"
showAboutMenuItem="1" legendScrollBarColor="c3d3fd" showValues="1" showAlternateVGridColor="1"
bgAlpha="100" decimals="1">
<vLine thickness="1" dashed="1" dashLen="11" dashGap="7" color="8064a2"/>
<set displayValue="5710,0%" value="5710" link="n-#cell,0,0" label="Май"/>
<vLine thickness="1" dashed="1" dashLen="11" dashGap="7" color="8064a2"/>
<set displayValue="14789,0%" value="14789" link="n-#cell,1,0" label="Июнь"/>
<vLine thickness="1" dashed="1" dashLen="11" dashGap="7" color="8064a2"/>
<set displayValue="21126,0%" value="21126" link="n-#cell,2,0" label="Апрель"/>
</chart>
-
Hello!
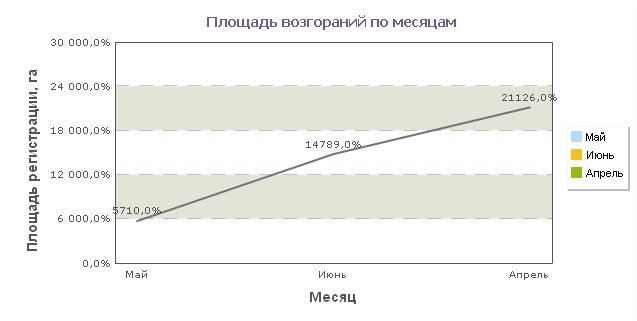
There are 2 chart type of Line:
first
<chart formatNumberScale="0" legendBorderAlpha="0" showPrintMenuItem="1" numberSuffix="%"
divLineThickness="1" bgColor="ffffff" thousandSeparator=" " alternateHGridAlpha="20"
canvasbgColor="ffffff" anchorAlpha="0" animation="0" alternateHGridColor="687e3c"
aboutMenuItemLink="n-http://www.contourcomponents.ru" vDivlineDashGap="7" showShadow="0"
showAlternateHGridColor="1" toolTipSepChar=": " formatNumber="1" showYAxisValues="1"
forceDecimals="1" numVDivLines="7" divLineColor="c0504d" legendBgColor="ffffff"
showLabels="1" legendScrollBgColor="ffffff" lineThickness="2" alternateVGridColor="337a85"
xAxisName="Месяц" vDivlineColor="8064a2" divLineDashGap="10" divLineIsDashed="1" aboutMenuItemLabel="About Contour BI"
legendPosition="RIGHT" vDivlineDashLen="11" alternateVGridAlpha="20" dashed="1"
vDivlineThickness="1" legendScrollBtnColor="c3d3fd" canvasBorderThickness="1"
divLineDashLen="14" caption="Площадь возгораний по месяцам" decimalSeparator=","
yAxisName="Площадь регистрации, га" vDivLineisDashed="1" showBorder="0" showAboutMenuItem="1"
legendScrollBarColor="c3d3fd" showValues="1" showAlternateVGridColor="1" bgAlpha="100" decimals="1">
<set displayValue="5710,0%" value="5710" link="n-#cell,0,0" label="Май"/>
<set displayValue="14789,0%" value="14789" link="n-#cell,1,0" label="Июнь"/>
<set displayValue="21126,0%" value="21126" link="n-#cell,2,0" label="Апрель"/>
</chart>
second:
<chart formatNumberScale="0" legendBorderAlpha="0" showPrintMenuItem="1" numberSuffix="%"
divLineThickness="1" bgColor="ffffff" thousandSeparator=" " alternateHGridAlpha="20"
canvasbgColor="ffffff" anchorAlpha="0" animation="0" alternateHGridColor="687e3c"
aboutMenuItemLink="n-http://www.contourcomponents.ru" vDivlineDashGap="7" showShadow="0"
showAlternateHGridColor="1" toolTipSepChar=": " formatNumber="1" showYAxisValues="1"
forceDecimals="1" divLineColor="c0504d" legendBgColor="ffffff"
showLabels="1" legendScrollBgColor="ffffff" lineThickness="2" alternateVGridColor="337a85"
xAxisName="Месяц" vDivlineColor="8064a2" divLineDashGap="10" divLineIsDashed="1" aboutMenuItemLabel="About Contour BI"
legendPosition="RIGHT" vDivlineDashLen="11" alternateVGridAlpha="20" dashed="1"
vDivlineThickness="1" legendScrollBtnColor="c3d3fd" canvasBorderThickness="1"
divLineDashLen="14" caption="Площадь возгораний по месяцам" decimalSeparator=","
yAxisName="Площадь регистрации, га" vDivLineisDashed="1" showBorder="0" showAboutMenuItem="1"
legendScrollBarColor="c3d3fd" showValues="1" showAlternateVGridColor="1" bgAlpha="100" decimals="1">
<set displayValue="5710,0%" value="5710" link="n-#cell,0,0" label="Май"/>
<set displayValue="14789,0%" value="14789" link="n-#cell,1,0" label="Июнь"/>
<set displayValue="21126,0%" value="21126" link="n-#cell,2,0" label="Апрель"/>
</chart>
They differ in that the first contains
numVDivLines="7"
, second is not.
The first chart shows the vertical lines but the second is not. Question: how to make a visible vertical lines, not setting the property numVDivLines ?
Thanks
-
Thanks, it solved the problem!
-
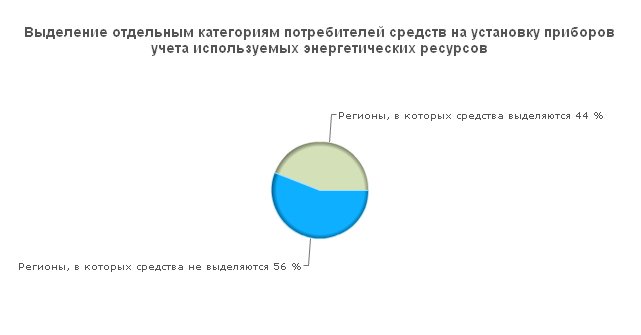
Hi!
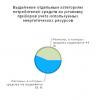
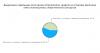
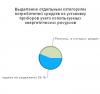
Using version 3.2.2. When the window is reduced labels are cut off. How to show the whole text (label in a few lines?)? Smart Labels no results
Thanks
<chart toolTipSepChar=": " showAboutMenuItem="1" decimals="0" animation="0" showPercentValues="0" forceDecimals="1" AlternateHGridColor="f7f7f7"
caption="Выделение отдельным категориям потребителей средств на установку приборов учета используемых энергетических ресурсов"
showValues="1" use3DLighting="1" canvasBorderThickness="1" decimalSeparator="," formatNumber="1" canvasbgColor="ffffff" showShadow="0" bgAlpha="100"
thousandSeparator=" " showYAxisValues="0" showBorder="0" showPrintMenuItem="1" formatNumberScale="0" aboutMenuItemLabel="About Contour BI"
aboutMenuItemLink="n-http://www.contourcomponents.ru" bgColor="ffffff" showLabels="0" xAxisName="Год" legendBorderAlpha="0" showPercentInToolTip="0" showLegend="0" yAxisName="">
<set displayValue="Регионы, в которых средства выделяются 44 %" value="43.9593" link="n-#cell,0,0" color="d2e0b4" label="Регионы, в которых средства выделяются"/>
<set displayValue="Регионы, в которых средства не выделяются 56 %" value="56.0407" link="n-#cell,0,0" color="00aaff" label="Регионы, в которых средства не выделяются"/>
</chart>
-
-
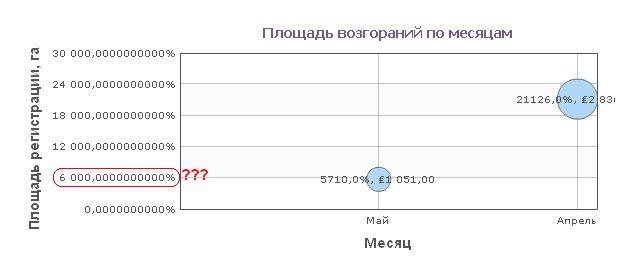
Hi
I created a bubble chart.
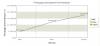
<chart toolTipSepChar=": " showAboutMenuItem="1" decimals="1" animation="0" legendScrollBarColor="c3d3fd" forceDecimals="1" AlternateHGridColor="f7f7f7" caption="Площадь возгораний по месяцам" showValues="1" xAxisMinValue="-1" legendScrollBtnColor="c3d3fd" canvasBorderThickness="1" is3D="0" decimalSeparator="," formatNumber="1" canvasbgColor="ffffff" showShadow="0" bgAlpha="100" thousandSeparator=" " numberSuffix="%" showYAxisValues="1" showBorder="0" showPrintMenuItem="1" formatNumberScale="0" legendPosition="RIGHT" legendScrollBgColor="ffffff" legendBgColor="ffffff" aboutMenuItemLabel="About Contour BI" aboutMenuItemLink="n-http://www.contourcomponents.ru" bgColor="ffffff" showLabels="1" xAxisName="Месяц" legendBorderAlpha="0" clipBubbles="1" yAxisName="Площадь регистрации, га">
Parameters for the number format:
decimals="1" forceDecimals="1" showValues="1" decimalSeparator="," formatNumber="1" thousandSeparator=" " numberSuffix="%" showYAxisValues="1" formatNumberScale="0"
But 1 decimal place on the axis Y is not displayed
[
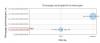
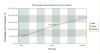
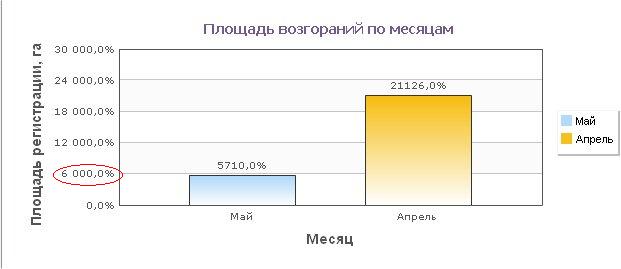
Column chart with the same parameters is displayed correctly:

Please what is wrong in the buble xml? Does not refer to the documentation..


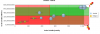
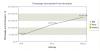
Thousand separator
in XML Issue
Posted · Report reply
For example: we have two facts (Fact1 and Fact2, the range of values of the facts may be different) and build bubble diagram:
In our application for each fact independently the user may specify the format of fact.
Decimal precision separately for each axis can be set using yAxisValueDecimals and xAxisValueDecimals.
But our users are unhappy mistake that thousands separator specified for one fact applies to other facts. How to explain them this error?