
prajna
-
Content count
4 -
Joined
-
Last visited
Posts posted by prajna
-
-
I am on FusionCharts XT 3.2.2 SR1 and it is a "MSCombiDY2D" chart. It renders fine in flash.
-
I didn't generate the XML myself, I used the class in FusionCharts_Gen.php. Here is the XML it returns when I use getXML, it's just the sample data from a demo:
<chart caption='Runtime Hours and kW/h per day' PYAxisName='Runtime' NumberSuffix=' hours' SYAxisName='Energy' numberPrefix='' sNumberSuffix=' kW/h' ><categories ><category label='Sun - Jan 01' /><category label='Sun - Jan 02' /><category label='Sun - Jan 03' /><category label='Sun - Jan 04' /><category label='Sun - Jan 05' /></categories><dataset seriesName='Runtime (hrs)' showValues='0' ><set value='576000' /><set value='448000' /><set value='500000' /><set value='734000' /></dataset><dataset seriesName='Energy (Avg kW/h)' showValues='0' parentYAxis='S' ><set value='576' /><set value='448' /><set value='999' /><set value='734' /></dataset></chart>
-
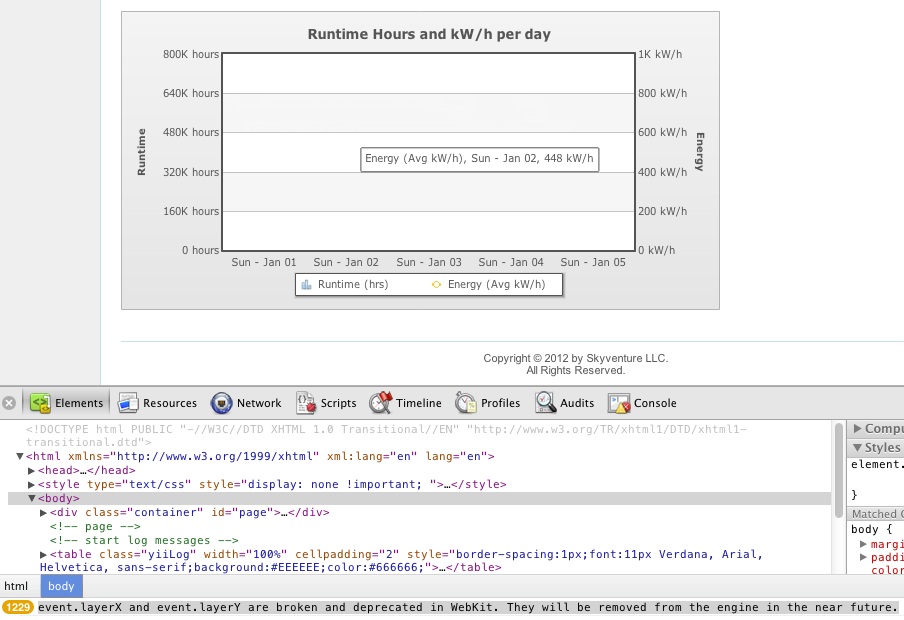
So I'm using the latest version of FusionCharts and Chrome 18 for OSX and trying to create a chart using the PHPClass library. It works fine in flash but when I set the rendering method to javascript, the chart will load and I can see the basic info, labels, axes, etc, but no data actually on the chart. The page loads with no javascript errors but when I move my mouse around over the chart I can see the labels for the data points and the following message shows up in my js error console:
"event.layerX and event.layerY are broken and deprecated in WebKit. They will be removed from the engine in the near future."
I noticed the minified version of jqueryincluded with FusionCharts is old so tried updating it to the latest version but it makes no difference.
Javascript Chart Not Displaying In Chrome + Errors
in Javascript Problems
Posted · Report reply
Any updates on this?