
Osvano
-
Content count
6 -
Joined
-
Last visited
Posts posted by Osvano
-
-
Hi Bindhu,
Thank you for your response,
My problem is as follows:
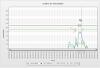
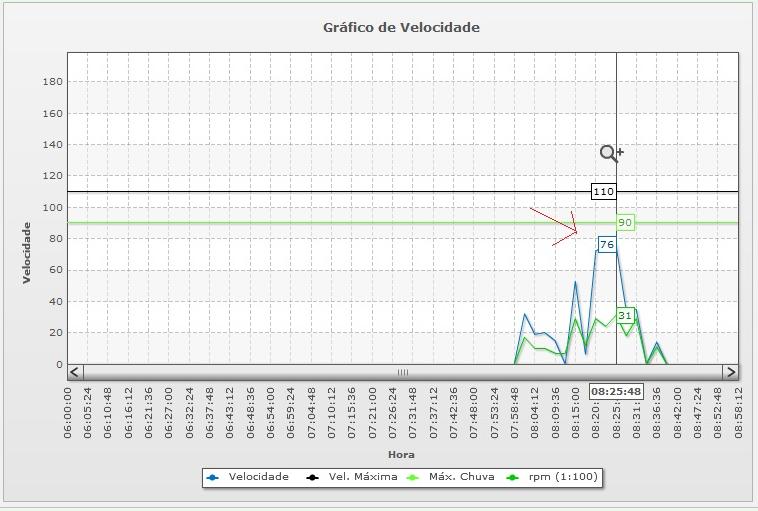
My chart is shown a zoom of 3 hours, as stated "image1.jpg". My series (blue) shows 76.
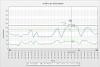
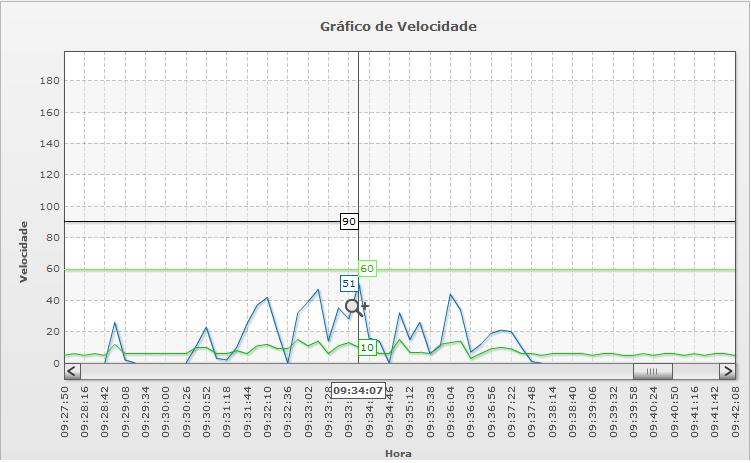
By zooming mine is shown in figure "image2.jpg".
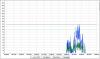
My client would like the graph shown in figure "image1.jpg" was the way it is on the "image3.jpg", generated by another component, showing the peaks of the series.
You can do this with FusionCharts?
I thank the attention,
Osvano
-
Hi, thanks for your answer.
My company has purchased FusionCharts XT (v3.2.2) , however, I'm just getting to use it in flash, where I put
<script type="text/javascript" src="js/jquery.min.js"></script>
I have a conflict with "jquery.maskedinput-1.3.js" of Richfaces.
I need to provide my chart to access the iPad, what can I do?
Thank you,
Osvano
-
Hi All,
My company has purchased FusionCharts XT (v3.2.2) and we're going to implement zoomline chart in our product.
My problem is as follows:
We need a zoom graph to display the information every second day.
If the chart is in macroscopic view, many data points are skipped in order to accommodate the entire series of data.
As shown in the pictures attached:Image1.jpg shows the total zoom, where the blue line shows 34.
When you zoom the blue line is replaced by the highest point in 51 as image2.jpg.
How do I show more precisely as macro?
I thank the attention,
Osvano
-
Hello,
I'm using FusionCharts and I have the following problem:
I'm developing a site in Java using JSF 1.2 with RichFaces, includes a page that will be responsible for Zoomline my chart.
My problem is that this graph has four series and each series would need 86,400 points, which would every second day, this amount of points can be used?<br class=""> It's getting very slow when I send draw all these points ...
An example of six hours which equates to 21,600 point, is taking 1 minute to draw this graph.
What can I do to solve?
Thank you,
Osvano
-
Hello,
I'm new to use FusionCharts and I have the following problem:
I'm developing a site in Java using JSF 1.2 with RichFaces, includes a page that will be responsible for Zoomline my chart,
my chart is loaded without problems in Flash,
but I'm not getting it to be loaded in HTML5 where Flash is not supported.
I put the following files in the folder:
FusionCharts.HC.Charts.js
FusionCharts.HC.js
FusionCharts.js
highcharts.js
jquery.min.js
lib.js
I made the call FusionCharts.js like this:
<script type="text/javascript" src="#{facesContext.externalContext.requestContextPath}/paginas/graficos/graficoVelocidade/arquivos/FusionCharts.js"></script>
But my chart is only rendered in HTML5 when I call explicitly jquery.min.js. The problem is that the call of this file explicit makes that I have conflicts with jQuery's of RichFaces.
What can I do to solve?
Thank you,
Osvano


Zoomline More Precisely As Macro
in Javascript Problems
Posted · Report reply
Hi Bindhu,
Thank you for your response,
The client company did not accept this solution.
You have to customize the Zoomline for us so that it meets this feature?If yes, how much would this customization?
I thank the attention,
Osvano