
kywolf
-
Content count
21 -
Joined
-
Last visited
Posts posted by kywolf
-
-
That's great. We'll be watching the website

-
Any ETA here?
-
Hi,
Are you still planning on releasing the newest version of FusionCharts by the end of this month?
-
Is there any chance of getting a beta so we can see the fix in place?
-
Thanks. Any ETA on the next release?
-
I put the radius='0' with the wrong tag. That does help. Thanks!
-
How can I hide the pointer on a linear gauge? Also, how can I indent the pointer value so that it is to the left of the pointer instead of middle?
Is it possible to do a horizontal thermometer gauge?

-
Any progress finding the root issue?
-
Hi,
Just wondering if you have been able to recreate this issue we are seeing?
-
What do you mean by scaled down? Do you want me to send you the code? The site has confidential data on it and requires a login so I cannot get you access to the charts.
I attached the code to one of the charts and a screen shot of what the chart looked like.
Here's an example of the live data feed:
&label=11:53 AM&value=23|0
-
Perhaps you're overlooking what I think is the most interesting part. These are not new graphs. We've had these graphs on a site for over a year. It was when we changed from Flash to JavaScript that this issue began happening.
Also, we are always using the latest version of FusionChart/Widgets. I cannot see the video as it's blocked by work proxy.
-
We just pushed the JavaScript charts to the live prod site so there is some urgency with this. I'd appreciate any quick response you can provide.
-
Hi,
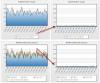
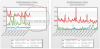
I can confirm that the values never got higher than 10. For whatever reason, the y-axis is scaling much higher than it should.
-
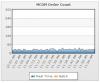
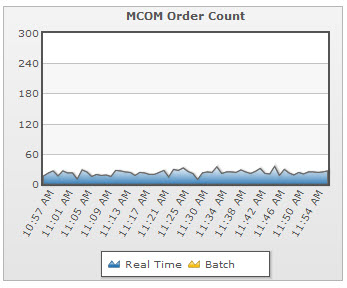
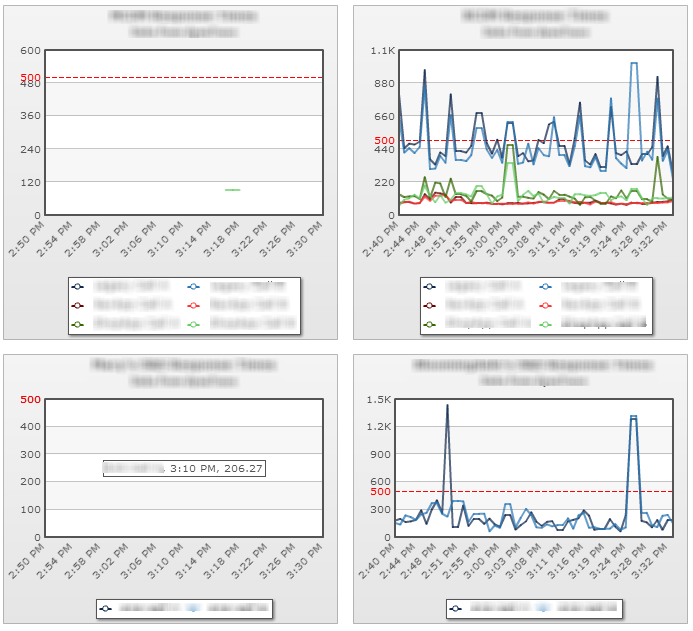
We've recently converted all our FusionCharts and FusionWidgets from Flash to JavaScript. After converting, we noticed that some of the real-time graphs don't scale properly when receiving new data. The load fine initially but at some point, the y-axis gets out of scale. Any idea how I can fix this?
-
We've been using SR2 since it was release: FusionWidgets XT (v3.3.1 - Service Release 2) (28th May, 2013)
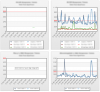
What do you mean by "scaled down sample"? We have several widgets on one page. Sometimes, the graphs don't draw the lines when the live data is feeding. When the page first loads, everything loads fine. When the widgets should be auto-updating, sometimes some of the graphs don't draw. They do receive data. I scrolled my mouse over 1 graph to show data is coming in but the lines don't draw. You can see with the scale that the graphs are getting data and since there are timestamps, you know data is coming through.
Any other suggestions?
-
Can't do a url. Do you want a sample of the live feed?
here is is:
&label=9:56 AM,9:57 AM&value=351.9267738679,405.84554257836|337.07273168701,393.32557354926|62.686596122678,56.889599185985|52.294279976593,52.773485971559|92.031124807396,84.460785848466|86.085653587093,77.912857862903
-
Thanks for the response.
We would like to have the option to use Area, Stacked Area, Column, Stacked Cloumn and Line in a combination real time widget. We currently have two charts on one page: a Stacked Area and a Line. We'd like to be able to combine these into 1 graph. Again, in a real-time widgets not just a FusionChart
-
Is there a plan to add a Real Time Combination Chart FusionWidget? Is it something that can be added in an upcoming release?
-
When the Real Time widgets load, the lines draw fine. When it is updating in the background, sometimes we see graphs like in the image. It is updating but the lines are not drawing to the graph. It is a very noticeable problem that many people have called out. It happens more often than not.
-
Hi,
Welcome to FusionCharts Forum!

No, the whole FusionCharts suite does not support rendering on ipad/iphone, as of now.
FusionCharts XT and PowerCharts v 3.2 support the HTML 5 charts, at this time.
Hope this helps.
When will the ENTIRE FusionWidgets XT Suite support Javascript/HTML 5? All the FusionWidgets that do not support HTML5 right now are the only widgets we use. I know you cannot provide me with an exact date...I just need to know if it is something that is being developed or if it is something that will not happen.
We've been very pleased with the FusionCharts suite especially since the move to JS/HTML5.


Real time scaling incorrectly
in Bug Reports
Posted · Report reply
This has gotten really bad. As you can imagine, people have lost patience with the issues we continue to experience with FusionCharts XT (3.3.1 SR3).
Time for us to move on and evaluate others.