
rhayward
-
Content count
10 -
Joined
-
Last visited
Posts posted by rhayward
-
-
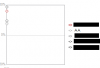
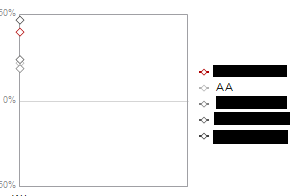
Displaying ampersand as part of seriesName in fusions charts not working the same in IE as Firefox/Chrome. (especially IE 8). Attached are the relative outputs. The short version is that IE is not displaying the Ampersand, or anything after, while in Firefox/Chrome, the Ampersand is showing appropriately.
Here's the XML:
<chart defaultAnimation='0' plotGradientColor=' ' showBorder='0' canvasBorderColor='A0A0A4' bgcolor='FFFFFF' canvasBorderThickness='1' canvasBorderAlpha='100' canvasbgColor='FFFFFF' canvasbgAlpha='0' canvasTopMargin='8' canvasBottomMargin='0' chartTopMargin='5' chartBottomMargin='0' chartLeftMargin='0' formatNumberScale='0' numDivlines='0' divLinecolor='969696' showLegend='1' legendCaption='' legendIconScale='1' legendPosition='RIGHT' legendBgColor='FFFFFF' legendBgAlpha='0' legendBorderColor='FFFFFF' legendBorderThickness='0' legendBorderAlpha='0' legendShadow='0' legendAllowDrag='0' interactiveLegend='1' legendNumColumns='1' minimiseWrappingInLegend='1' baseFont='Arial' baseFontSize='14' baseFontColor='000000' outCnvbaseFontSize='14' outCnvbaseFontColor='969696' showtoolTip='1' toolTipBorderColor='969696' toolTipBgColor='969696' xAxisName='' labelDisplay='Wrap' yAxisName='' showYAxisValues='1' yAxisMinValue='-50' yAxisMaxValue='50' numberSuffix='%'> <categories> <category label='W1' tooltext='Wave 1'/> </categories> <dataset seriesName='AAAA' color='#B00000' anchorSides='4' anchorRadius='4' > <set value='40' showValue='0' /> </dataset> <dataset seriesName='AA&A' color='#B2B2B2' anchorSides='4' anchorRadius='4' > <set value='22' showValue='0' /> </dataset> <dataset seriesName='AAAA' color='#7F7F7F' anchorSides='4' anchorRadius='4' dashed='1' lineDashLen='1'> <set value='19' showValue='0' /> </dataset> <dataset seriesName='AAAA' color='#595959' anchorSides='4' anchorRadius='4' dashed='1' lineDashLen='2'> <set value='24' showValue='0' /> </dataset> <dataset seriesName='EEEE' color='#404040' anchorSides='4' anchorRadius='4' dashed='1' lineDashLen='3'> <set value='47' showValue='0' /> </dataset> <styles> <definition> <style name='MSTitle' type='font' size='12' color='1B1E1A' /> <style name='MSSubTitle' type='font' size='10' color='969696' /> <style name='Stubs' type='font' size='11' color='1B1E1A' /> <style name='Data' type='font' size='11' color='1B1E1A' /> <style name='RollOver' type='font' size='10' color='FFFFFF' /> <style name='AxisLabels' type='font' size='9' color='969696' /> </definition> <application> <apply toObject='caption' styles='MSTitle' /> <apply toObject='subcaption' styles='MSSubTitle' /> <apply toObject='DataLabels' styles='Stubs' /> <apply toObject='DataValues' styles='Data' /> <apply toObject='Legend' styles='Data' /> <apply toObject='toolTip' styles='RollOver' /> <apply toObject='yAxisValues' styles='AxisLabels' /> </application> </styles> </chart>
We've tried many different replacements for the Ampersand, but none of them worked in both places:
- &
- &
- %26
- &
- &%26;
- & - This worked in IE, but broke in Firefox & chrome
So, how can we consistently have an Ampersand displayed in the labels for an MSLine chart?

-
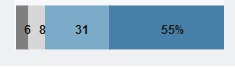
When using the javascript renderer to render StackedBar2D charts, I'm finding the labels are shifted over approximately 6 pixels to the right of center. I've attached the image of how it renders.
Here's the xml:
<chart defaultAnimation='0' bgColor='FFFFFF' showBorder='0' plotGradientColor=' ' showPlotBorder='0' canvasBorderAlpha='0' canvasbgColor='FFFFFF' canvasbgAlpha='0' canvasTopMargin='10' canvasBottomMargin='0' canvasLeftMargin='0' canvasRightMargin='0' chartTopMargin='0' chartBottomMargin='0' chartLeftMargin='0' chartRightMargin='0' formatNumberScale='0' numDivlines='0' divLinecolor='969696' placevaluesinside='1' plotSpacePercent='0' showLegend='0' baseFont='Arial' baseFontSize='14' baseFontColor='000000' outCnvbaseFontSize='14' outCnvbaseFontColor='969696' showtoolTip='1' toolTipBorderColor='969696' toolTipBgColor='969696' xAxisName='' yAxisName='' showYAxisValues='0' yAxisMinValue='0' yAxisMaxValue='100' > <categories> <category label='' /> </categories> <colorRange> <color minValue='' maxValue='' code='A6A6A6'/> <color minValue='' maxValue='' code='CCCCCC'/> <color minValue='0' maxValue='100' code='D6D6D6'/> </colorRange> <dataset seriesName='0-4' color='7F7F7F'> <set value='6' displayValue='6' /> </dataset> <dataset seriesName='5' color='D6D6D6'> <set value='8' displayValue='8' /> </dataset> <dataset seriesName='6-8' color='7CABC9'> <set value='31' displayValue='31' /> </dataset> <dataset seriesName='9-10' color='4680A8'> <set value='55' displayValue='55%' /> </dataset> <dataset seriesName='DK' color='null'> <set value='0' displayValue='0' showValue='0'/> </dataset> <styles> <definition> <style name='MSTitle' type='font' size='12' color='1B1E1A' /> <style name='MSSubTitle' type='font' size='10' color='969696' /> <style name='Stubs' type='font' size='11' color='1B1E1A' /> <style name='Data' type='font' size='12' color='1B1E1A' /> <style name='RollOver' type='font' size='12' color='FFFFFF' /> <style name='AxisLabels' type='font' size='9' color='969696' /> </definition> <application> <apply toObject='caption' styles='MSTitle' /> <apply toObject='subcaption' styles='MSSubTitle' /> <apply toObject='DataLabels' styles='Stubs' /> <apply toObject='DataValues' styles='Data' /> <apply toObject='toolTip' styles='RollOver' /> <apply toObject='yAxisValues' styles='AxisLabels' /> </application> </styles> </chart>
Here's the javascript used to render:
FusionCharts.setCurrentRenderer('javascript');

var myChart = new FusionCharts( "/Fusion/Charts/StackedBar2D.swf", "chartStackedHBar1", "210", "55", "0", "0" );
myChart.setTransparent(true);

myChart.setXMLData( data );
myChart.configure( "ChartNoDataText", "No data available." );
myChart.render( divName );
As best I can tell, the version of FusionCharts used is:
 FusionCharts JavaScript Library
 Copyright FusionCharts Technologies LLP
 License Information at <http://www.fusioncharts.com/license>

 @author FusionCharts Technologies LLP
 @version fusioncharts/3.2.3-sr1.5347

-
Hi,
Are you using FusionCharts XT pack or entire FusionCharts Suite?
I'm afraid I don't know that - How could I tell?
-
Hi,
Please confirm if you have included following necessary JavaScript files into your project folder?
> FusionCharts.js
> FusionCharts.HC.js
> FusionCharts.HC.Widgets.js
> jquery.min.js
If this does not help to resolve your issue, please revert.
I have most of those, save FusionCharts.HC.Widgets.js. I suppose not having FusionCharts.HC.Widgets.js is most likely my problem. How could I get that?
> FusionCharts.js
- /* FusionCharts JavaScript Library Copyright FusionCharts Technologies LLP License Information at <http://www.fusioncharts.com/license> @author FusionCharts Technologies LLP @version fusioncharts/3.2.2-servicerelease.4068 Third-party attributions: SWFObject v2.2 <http://code.google.com/p/swfobject/> JSON v2 <http://www.JSON.org/js.html> Firebug Lite 1.3.0 <http://getfirebug.com/firebuglite> jQuery 1.4.2 <http://jquery.com/> */
> FusionCharts.HC.js
- /* Highcharts JS v2.1.6 (2011-07-08) Exporting module © 2010-2011 Torstein H?nsi License: www.highcharts.com/license */
> FusionCharts.HC.Widgets.js
missing
> jquery.min.js
- /*! * jQuery JavaScript Library v1.4.2 * http://jquery.com/ * * Copyright 2010, John Resig * Dual licensed under the MIT or GPL Version 2 licenses. * http://jquery.org/license * * Includes Sizzle.js * http://sizzlejs.com/ * Copyright 2010, The Dojo Foundation * Released under the MIT, BSD, and GPL Licenses. * * Date: Sat Feb 13 22:33:48 2010 -0500 */
-
I'm trying to display an Widgets/HLinearGauge.swf chart with the javascript renderer. It renders fine via flash, but fails to render via javascript. There's a javascript error which pops up:
Timestamp: 7/24/2012 10:23:34 AM
Error: TypeError: mb[v[v.length - 1]] is undefined
Source File: https://xxx/xxx/Fusi...ionCharts.HC.js
Line: 92
The FusionCharts.HC.is file has version
/*
Highcharts JS v2.1.6 (2011-07-08)
Exporting module
© 2010-2011 Torstein H?nsi
License: www.highcharts.com/license
*/
-
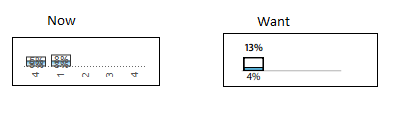
I'm preparing a StackedColumn2D chart, and some of my data is very small (0-2%), but I need to keep the charts on a 100% scale. When I show values, they are "squashed" into the very small column (see attached under "Now"). I'd like to be able to specify that the values should show above one Set and below another Set (see attached under "Want"). Is there any way to do that?

-
My best understanding is that I have the right version. Here's the md5sum of all the js files:
8334d2f30a26dd1bf5978ca1549b6166 FusionCharts.HC.Charts.js
9fcdac7932c8e97be680e890278fcec4 FusionCharts.HC.js
843c1d7c575fb0f937412d5002999bac FusionCharts.jqueryplugin.js
08c2e9b56498a040a728fbd3628afe8e FusionCharts.js
36f8f0c2e2c17b11021c9be45149f6f7 FusionChartsExportComponent.js
Here's the header from FusionCharts.js:
/*
FusionCharts JavaScript Library
Copyright FusionCharts Technologies LLP
License Information at <http://www.fusioncharts.com/license>
@author FusionCharts Technologies LLP
@version fusioncharts/3.2.2-servicerelease.4068
Third-party attributions:
SWFObject v2.2 <http://code.google.com/p/swfobject/>
JSON v2 <http://www.JSON.org/js.html>
Firebug Lite 1.3.0 <http://getfirebug.com/firebuglite>
jQuery 1.4.2 <http://jquery.com/>
*/
Could you verify if I have the right version of the FusionCharts.HC.Charts.js file?
Could someone verify this for me? Or is there something else I can do to make sure I have the right version of this file?
-
There is a possibility that you forgot to replace all your files while transitioning from trial to licensed version. You need to replace all js files along with all swf files. For your case, it seems you missed out on replacing FusionCharts.HC.Charts.js
My best understanding is that I have the right version. Here's the md5sum of all the js files:
8334d2f30a26dd1bf5978ca1549b6166 FusionCharts.HC.Charts.js
9fcdac7932c8e97be680e890278fcec4 FusionCharts.HC.js
843c1d7c575fb0f937412d5002999bac FusionCharts.jqueryplugin.js
08c2e9b56498a040a728fbd3628afe8e FusionCharts.js
36f8f0c2e2c17b11021c9be45149f6f7 FusionChartsExportComponent.js
Here's the header from FusionCharts.js:
/*
FusionCharts JavaScript Library
Copyright FusionCharts Technologies LLP
License Information at <http://www.fusioncharts.com/license>
@author FusionCharts Technologies LLP
@version fusioncharts/3.2.2-servicerelease.4068
Third-party attributions:
SWFObject v2.2 <http://code.google.com/p/swfobject/>
JSON v2 <http://www.JSON.org/js.html>
Firebug Lite 1.3.0 <http://getfirebug.com/firebuglite>
jQuery 1.4.2 <http://jquery.com/>
*/
Could you verify if I have the right version of the FusionCharts.HC.Charts.js file?
-
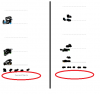
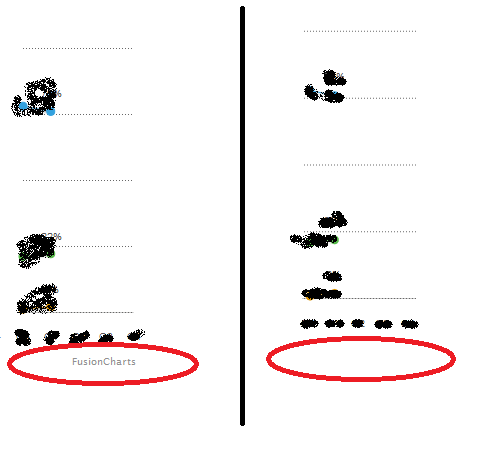
When my charts render via javascript/HTML5 (via FusionCharts.setCurrentRenderer('javascript'); or via no Flash on the browser), my charts show "credits" at the bottom. When my charts render via Flash, I get no credits. In the picture, the left side is rendered with javascript/HTML5 and the right side is rendered with Flash. My question is: Why would this be happening? Could it be licensing? If so, how can I verify? Is there something I can put in my XML to stop it from showing up?

controlling multiple MSLine2d charts from a single legend
in General usage
Posted · Report reply
I'd like to be able to control multiple MSLine2d charts from a single legend - is that possible? If so, how would I go about doing so?