
Dinesh M
-
Content count
12 -
Joined
-
Last visited
Posts posted by Dinesh M
-
-
Hi,
As per the documentation of "Box and Whisker charts" (http://docs.fusionch...om/powercharts/ > given here) caclulation show for calculation median and lower Quartile is seems to be wrong, I have checked the documentation on wikipedia as well (http://en.wikipedia....-number_summary).
As per the example given in the above wikipedia link following data set is considered:
0, 0, 1, 2, 13, 27, 61, 63
and result of the above data set is coming as
0, 0.5, 7.5, 44, 63 (output as per wikipedia)
But if Input the above data set(0, 0, 1, 2, 13, 27, 61, 63) then the following output is coming(shown on tool tip)
0, 0.25, 7.5, 52.5, 63 (output as per box and whisker chart)
So is this the bug in box and whisker charts? or Am I missing something here.
Also let me know if it is possible in box and whisker chart to calculate Q1 and Q3 values or median also.
Thanks,
Dinesh
- Median (Q2): N+1/2 (where N=total number of elements in a set of data)
- Lower Quartile (Q1): N+1/2 (where N=total number of elements in a set of data)
Can any one reply to the above post, as I am in the process of purchasing the license for Fusion Charts all library's and before that I need to know the justification for the calulation of Box and Whisker chart.
Thanks,
Dinesh
-
Hi Dinesh,
Yes, it is possible to display scroll bar using Scroll Bar charts.

The scroll charts are used in dashboards and monitors when there is a lot of data to show, but very little space. Instead of accommodating all data in the constrained space, you can use a scroll charts to increase the space and display the data better.
For more demos, please refer the following link:
http://www.fusioncha.../#scroll-charts
It will not be possible to show the scroll bar as data grows on X axis. By default, scroll bar appears.
Hope this helps.
Hi,
Thanks for you reply, But I need scroll bar for "Box and Whisker" power charts, as I am unable to find any way to implement scroll bar for
1 - Box and whisker power charts
2 - stackedbar2d and stackedarear2d fusion charts
Please let me know if it is possible to display scroll bar for the above types of charts.
Thanks,
Dinesh
-
Hi,
I have implemented many fusion chart library's but one problem I am facing here is when data is growing then that data is shown without scroll bar.
In fusion chart can we display the scroll bar if data is growing on x-axis?
Please let me know if this is possible in fusion charts.
Thanks,
Dinesh
-
Hi,
As per the documentation of "Box and Whisker charts" (http://docs.fusioncharts.com/powercharts/ > given here) caclulation show for calculation median and lower Quartile is seems to be wrong, I have checked the documentation on wikipedia as well (http://en.wikipedia.org/wiki/Five-number_summary).
As per the example given in the above wikipedia link following data set is considered:
0, 0, 1, 2, 13, 27, 61, 63
and result of the above data set is coming as
0, 0.5, 7.5, 44, 63 (output as per wikipedia)
But if Input the above data set(0, 0, 1, 2, 13, 27, 61, 63) then the following output is coming(shown on tool tip)
0, 0.25, 7.5, 52.5, 63 (output as per box and whisker chart)
So is this the bug in box and whisker charts? or Am I missing something here.
Also let me know if it is possible in box and whisker chart to calculate Q1 and Q3 values or median also.
Thanks,
Dinesh
- Median (Q2): N+1/2 (where N=total number of elements in a set of data)
- Lower Quartile (Q1): N+1/2 (where N=total number of elements in a set of data)
-
Hi,
I am using "Ganttr" Chart and in that due to heavy loading of data it is taking some time to load as in my database if 10k records are present then on the x-axis(categories) are loading at slower rate and along with that if calculations are done on such a large set of data it is taking a much time.
So to avoid this , I need some thing called as "incremental data loading" as first I want to load the all categories and process then if they are loaded then I need to load all tasks shown inside the Gantt chart
So is there any mechanism available by which I will be able to incrementally load the data and display to the user.
Please let me know if we can do something like the above mentioned scenario.
Thanks,
Dinesh
-
Hi,
I am using "Box and Whisker" power chart and in that due to heavy loading of data it is taking some time to load as in my database if 10k records are present then on the x-axis(categories) are loading at slower rate and along with that if calculations are done on such a large set of data it is taking a much time.
So to avoid this , I need some thing called as "incremental data loading" as lets say if on x-axis I have to display 100 or 1000 application's data then instead of loading the data for 1000's apps I would like to load the data for those app's(shown on x-axis) which are seen in the scroll abr area lets say (10 app's are shown at a time using scroll bar in x-axis).
So is there any mechanism available by which I will be able to incrementally load the data and display to the user and when user will further scroll down then for next app's data should be loaded in this way the performance of charts will increase.
Please let me know if we can do something like the above mentioned scenario.
Thanks,
Dinesh
-
Hi,
I have implemented the Gantt chart using "FusionWidget" Library and in that I am displaying the different tasks using "Task Bars". As per my current implementation labels are displayed for each task bar outside the task bar boundary. But I want to show the labels for each task bar inside the task bar boundary.
Is there any way I can show the label's inside tasks bars?
Thanks,
Dinesh
-
Hi,
You can divide single task into multiple tasks.
Refer the following link for more information:
Thanks for the link!! It worked for me..
-
I have a muli-task gantt chart that displays dynamic project progress for people.
I need to have the ability to stop a task and introduce a break in it but allow the chart to show that while still displaying all the other information.
e.g. Task A gets 50% through and then task D gets introduced with a higher priority. I want to be able to show a stop in Task A with 50% complete and Task D started.
Hi,
Did you got any solution to this problem, I am also searching for the solution of the above mentioned problem. Please let me know if you have/got any solution to the above problem.
Thanks,
D
-
Hi,
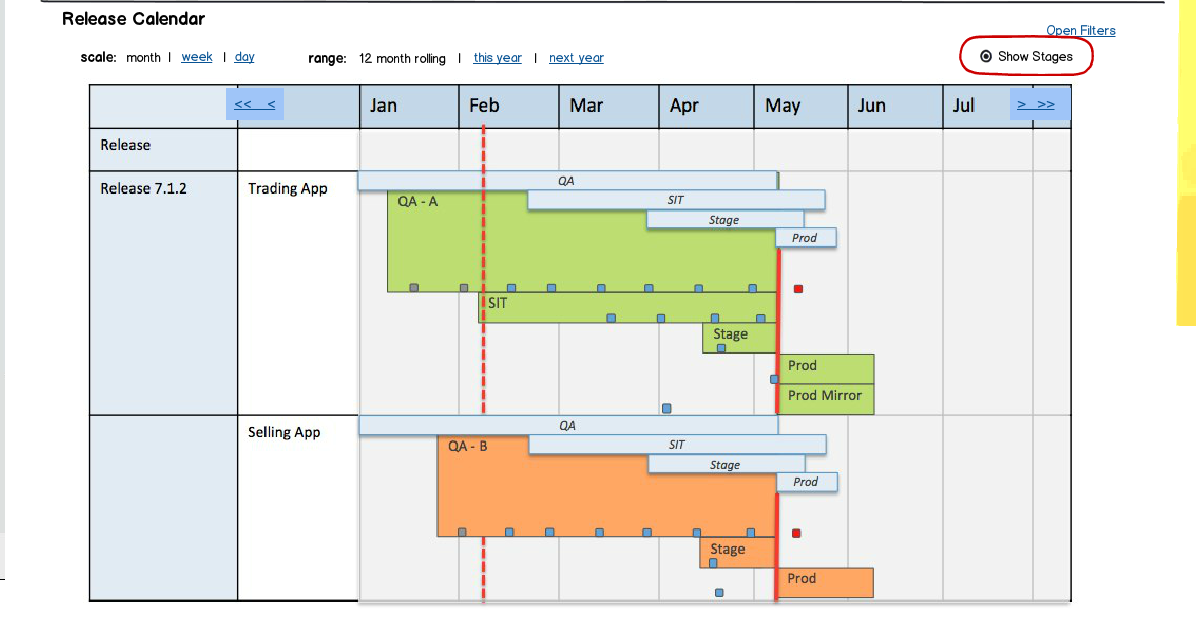
Can we break down the task for each individual tasks, I need a scenario similar to the attached image.
if any one has any idea then please let me know.

Thanks,
Dinesh
-
Hi,
I am implementing Gantt chart in Ruby on Rails application and I was looking for some demo application which has used Gantt Chart with "FusionWidget" Library.
Please let me know if any demo app is available which has used Gantt charts.
Thanks in advance.
Dinesh
Can Scroll Bar Be Shown For Any Fusion Chart
in Using PowerCharts XT
Posted · Report reply
Is there any alternative for the above problem for box and whisker charts as I am in the process of purchasing the license. Also can any one from the technical team contact me before I go ahead for purchasing the license.
Thanks,
Dinesh