
Ganesh Bora
-
Content count
8 -
Joined
-
Last visited
Posts posted by Ganesh Bora
-
-
Hi ,
Welcome to FusionCharts Forum!
We are looking into this and we will get back to you on this shortly.
Hi,
I'm getting this error in the FireBug console when I fire the function which loads the chart the second time.
This is my code insde this function:
   if (FusionCharts(domID)) {


                $("div[id$=" + containerID + "Body]").children(':first').updateFusionCharts({ "dataSource": "../../" + parChart.getDataURL(),
                    "dataFormat": "xmlurl"
                });

            } else {


                $("div[id$=" + containerID + "Body]").children(':first').insertFusionCharts({ "id": domID,
                    "swfUrl": type,
                    "renderer": "javascript",
                    "dataSource": "../../" + parChart.getDataURL(),
                    "dataFormat": "xmlurl",
                    "width": width,
                    "height": height
                });

            }
My question is - how do I set the chart created by insertFusionCHart to a variable? It's possible without the jQuueryy plugin - but how do I do it now?
Thanks.
I am also getting same error I have posted it @ http://forum.fusioncharts.com/topic/13627-chart-id-is-same-as-a-javascript-variable-name/
-
I'm getting the following error while embedding a chart:
DesignTimeError: #25081843 bodystats0.render Error >> #25081843:IECompatibility()
Chart Id is same as a JavaScript variable name.
Variable naming error. Please use unique name for chart JS variable, chart-id and container id.
http://static.ak.facebook.com/connect/xd_arbiter.php?version=21
Line 13
Please check page code
<script type="text/javascript" src="/js/jquery.jcarousel.min.js"></script> <script type="text/javascript"> jQuery(document).ready(function() { //jQuery('#mycarousel2').jcarousel({ //}); }); </script> <div class="carousel_1"> <ul id="mycarousel2" class="jcarousel-skin-tango"> <li> <div id="test1"> <?php Yii::app()->clientScript->registerCoreScript('fusionchartsxt'); ?> <?php include("fusionchartsxt/includes/FusionCharts.php"); ?> <?php $strXML = "<chart caption='' subCaption='' yAxisMaxValue='105' numberSuffix='%25' bgColor='FFFFFF' bgAlpha='0' setAdaptiveYMin='1' canvaspadding='10' showCanvasBg ='1' canvasBorderColor='333333' showAlternateHGridColor='1' alternateHGridColor='f0f2ea' alternateHGridAlpha='100' divLineColor='303200' divLineAlpha='20' baseFontColor='666666' showBorder='0' lineColor='BBDA00' plotBorderColor='8a8a8a' anchorRadius='4' anchorBgColor='303200' anchorBorderColor='FFFFFF' anchorBorderThickness='2' toolTipBgColor='EEEEEE' toolTipBorderColor='303200' toolTipColor='666666' showValues='1' numberSuffix='' labelDisplay='ROTATE'>"; $strXML .= "<set label='Asses 1' value='20' />"; $strXML .= "<set label='Asses 2' value='30'/>"; $strXML .= "<set label='Current' value='40' />"; $strXML .= "<trendlines>"; $strXML .= "<line startValue='100' color='57C02F' displayValue='Target' />"; $strXML .= "</trendlines>"; $strXML .= "<styles>"; $strXML .= "<definition>"; $strXML .= "<style name='Font_0' type='font' font='Verdana' size='11' underline='0' color='666666' />"; $strXML .= "<style name='Font_1' type='font' font='Verdana' size='14' color='666666' bold='1' align='left' />"; $strXML .= "<style name='LineShadow' type='shadow' angle='45' distance='1'/>"; $strXML .= "</definition>"; $strXML .= "<application>"; $strXML .= "<apply toObject='DATALABELS' styles='Font_0'/>"; $strXML .= "<apply toObject='CAPTION' styles='Font_1'/>"; $strXML .= "<apply toObject='DATAPLOT' styles='LineShadow' />"; $strXML .= "</application>"; $strXML .= "</styles>"; $strXML .="</chart>"; $unique_chart_id = "mygoalachievements1"; echo renderChart("/fusionchartsxt/charts/Column2D.swf?r=".rand(), "", $strXML, "$unique_chart_id", 235, 235); ?> </div> </li> </ul> <a href="#" id="ui-carousel-next"><span>next</span></a> <a href="#" id="ui-carousel-prev"><span>prev</span></a> </div> <script> console.log(mygoalachievements1); console.log($('#mygoalachievements1').get()); </script> -
Hi,
Would like to customize canvas background color in two alternative color bands please suggest how do we achive this.
please check attached image for more details

-
Hi,
We have 10 graphs on one page having ids like goal1, goal2, goal3, goal4...goal10
to show these all graphs we are using Jquery slider but using this gives an error
A duplicate object already exists with the specific Id: goal1
Please suggest how to resolve this issue..Due to this error last 2-3 graphs out of 10 are not getting loaded.
Thanks in advance..
-
Hi,
please check attached sample PHP code. fusionchart_sample.php
We are using V3.2.2 fusion chart
We have noticed that issue occur for <!DOCTYPE HTML> + IE9 + GPU renderring option of browser. Its works for Document Mode -Quirks
-
how to show legend for Column 2D single Series graph
-
Hi,
While using fusion chart am facing rendering issue on IE9 browser. graphs start render on mouse hover.
Issue get resolved on setting browser settings for Software Rendering inserted of GPU rendering. Has any one now about any workaround for same. Other than browser setting
Please check attachment for more details
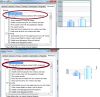


Chart Id Is Same As A Javascript Variable Name
in FusionCharts and PHP
Posted · Report reply
Hi,
I have resolved the issue by doing litte bit of debugging.
Actually is due to the calling php render method inside the loop of list element <li>
echo renderChart("/fusionchartsxt/charts/Column2D.swf?r=".rand(), "", $strXML, "$unique_chart_id", 235, 235);to resolve issue we have moved the render method outside the JCarsoal methode and only placed the chart div after render inside this li.