
Olives
-
Content count
20 -
Joined
-
Last visited
Posts posted by Olives
-
-
Hi,
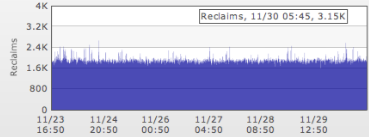
I am attaching a sample graph that shows the following issue. The datapoints are shown with 1 minute interval (high density)
We have a data point of value (x, y) = (05:45am, 3.15K). This can be seen in the tooltip when we scroll over but the point is invisible in the graph. Why is this so?
Thanks.
-
Hi,
The xml attached provides the error I was talking about.
The version used is 3.3.
Conditions to set:
SWF file used: MSCombiDY2D.swf
Chart width = 150
Chart height = 75
Issue occurs only when the renderAs is 'Bar'. When the attributes showPlotBorder='0' plotGradientColor='' are removed, then the plot will be shown.
Thanks.
-
Hi,
We are creating a chart (combined), with a time axis interval of 1 minute with information for a week.
We are plotting an area/bar chart for this. (for both axes.)
In the chart attributes, when we provide showPlotBorder='0' & plotGradientColor='', no charts are displayed.
But, on removal of these attributes, the charts get rendered.
Why is this so? Is there a solution to this? We require these attributes. This effect was not seen when the combined chart was rendered as a Line (renderAs='Line').
Thanks.
-
Could you tell me how to align the legend?
-
Hi,
I am quite new to Fusion charts & most of the attributes in Fusion Charts are unknown.
I wish to allign the Legend, which should be vertically placed one above the other.
Is this possible? Please reply ASAP.
Also is there a possibility to add additional information as a text close to the Legend area.
For example:
Suppose the Legend was being shown '[blue] tom' '[red] jerry' '[green] spike' (blue, red & green are colors).
Could I modify the legend (or add some text) for a similar pattern:
'[blue] tom avg salary:10 max salary:15' '[red] jerry avg salary:18 max salary:20' '[green] spike avg salary:5 max salary:7' (avg salary & max Salary were calculated from the related graph.)
-
Hi,
I am working on rendering of fusion charts on portlets (liferay-tomcat).
I actually tried the javascript invocation on a simple apache server and everything works fine.
But when i use it on liferay,things go for a toss.
In the velocity template ,i give the property for click url of the chart as follows:
clickURL='JavaScript:%26lt;portlet%3Anamespace%2F%26gt;TestMethod();'
Then pass the registerWithJS parameter as follows in jsp:
<%
String url=chart.getFusionChartSWFFile()+"?registerWithJS=1";
String chartHTMLCode=createChartHTML(url, "",strXML,"MainChartId_${loopStatus.index}", 400, 300, true);
%><%=chartHTMLCode%>
The javascript given in jsp is as follows:
pleasefind the code in ChartDebugger.txt attched.
The chart debugger has no errors.The javascript invocation in the chart debugger is as follows:ChartDebugger.txt attched.
If anyone has worked on fusioncharts for portlets or has any idea please feel free to suggest.
Thanks,
olives
-
hi,
Thank you for the reply.
I am making use of Fusion chart version 3.0.5.this does not work.
One of the forum posts mentioned using fusion 3.0.6 for the registerWithJS=1 to be working.
Will it work with the trial version of 3.0.6?
Thanks,
olives
-
Hi,
I am making use of the following method to loop through display a list of drilldown charts in my jsp.
Is there a way to use registerWithJS using this code?This parameter is present with the fusionChart constructor.
//Create the chart - Pie 3D Chart with data from strXML
String chartCode=createChartHTML("./FusionCharts/Column2D.swf", strXML, "" , "xyz", 600, 300, false);
%>
<%=chartCode%>
Thanks,
Olives
-
Hi,
the issue of javascript invocation got resolved .
Was missing the folowing:
To register the chart with JavaScript, we set the registerWithJS parameter to 1
var chart1 = new FusionCharts("../../FusionCharts/Column3D.swf", "chart1Id", "400", "300", "0", "1");
Realized this far too late.
Is there any way to set this parameter if we are using createChartHTML method?
Thanks,
Olives
-
hi,
I tried running this from a web server itself.
Thanks ,
olives.
-
Hi,
Could you tell me where i could look for help regarding this issue.The chart debugger gets the right js format but the the alert does not come up.
Thanks,
olives
-
Hi,
thanks so much for the code snippet.
clickURL='JavaScript: %26lt;portlet%3Anamespace%2F%26gt;TestMethod();'>
This helped to go further.
The xml generated by the chart debugger is coming correctly.
But on click of the chart ,the javascript does not get invoked.,this i suppose is an issue with the flash and macintosh.
I am using the intel mac(quad-Core Intel Xeon).
One of the forum posts mentioned that :
It occurs if you are running your HTML locally. By default Flash Player's security setting blocks invoking/calling JavaScript from SWF (Flash Movie), so you need to reset your setting into Global Security Setting panel.
Ref:http://www.fusioncharts.com/forum/Topic5009-47-1.aspx?Highlight=javascript+in+xml
Probably need to find how this can be fixed on my mac.
Is there mac version for including pluginspage='http://www.macromedia.com/go/getflashplayer' in the Fusion.jsp?
Thanks anyways!
Olives
-
Hi,
Could you let me know why is the issue occuring?
Thanks,
Olives.
-
Hi,
I tried out
clickURL='%26lt;portlet%3Anamespace%2F%26gt;TestMethod();'
but it did not work:-(
Actually thats the reason i was trying it on the sample fusion chart before moving to portlet.
Hope you can help me solve this.
-
Hi,
For the second issue,i tried running the sample from the apche tomcat server(apache-tomcat-6.0.18).
The chart renders ,but clicking on hyperlink does not display the alert
Please let me know if any more details required.
Thanks,
Olives.
-
-
Hi,
could someone help with this?
~Olives
-
Hi,
Thanks for the immediate reply.
Today i was trying the tutorial mentioned by the Fusion charts site:
http://www.fusioncharts.com/Docs/Index.html->Guide for WEb Developers->DrillDown charts->JSFunctions as links.
Tried out the code as is :
PFA the JSExample.xml, the JSExample.html(JSExample.txt), chart debugger log.
The chart renders ,but while clicking on the thumbnail nothing happens.
Thanks,
Olives
-
Hi,
I am are making use of velocity template to create the xml to render the chart on a portlet.when i click on the chart i want to invoke a javascript in clickURL attribute of the chart tag.
I am not sure what a missing here ,but the javascript function does not get invoked.
My javascript function is present in the jsp where i render the chart.
This is the javascript i want to invoke:
<portlet:namespace/> testMethod();
In my Velocity template this is formats i have tried ,but are not working.
clickURL='javascript:%3Cportlet%3Anamespace%2F%3ETestMethod()'

clickURL='javascript:TestMethod()'
The exception in the chart debugger is :
XML Data provided using dataXML method.
ERROR: Invalid XML encountered. An attribute value is not properly terminated. Check the XML data that you've provided. If you've special characters in your XML (like %, &, ' or accented characters), please URL Encode them.
The chart does not get displayed due to this error.
Please provide some pointers to what am missing in the encoded string that am using.Its very urgent.Stuck at this point.

Thanks,
Olives
Invisible datapoint
in Bug Reports
Posted · Report reply
Additional Info:
One reason what we believe is that could be a reason is that there may be adjacent null points on either sides of this data point.
a. If this be the case, is there a way to overcome this so that we can see this point?
b. Is it possible to anchor this orphan datapoint?
c. If a graph (line type or otherwise) is broken due to null points, is there a way to highlight these broken end points alone with anchors?
Thanks.