
Sumant Sarkar
-
Content count
4 -
Joined
-
Last visited
Posts posted by Sumant Sarkar
-
-
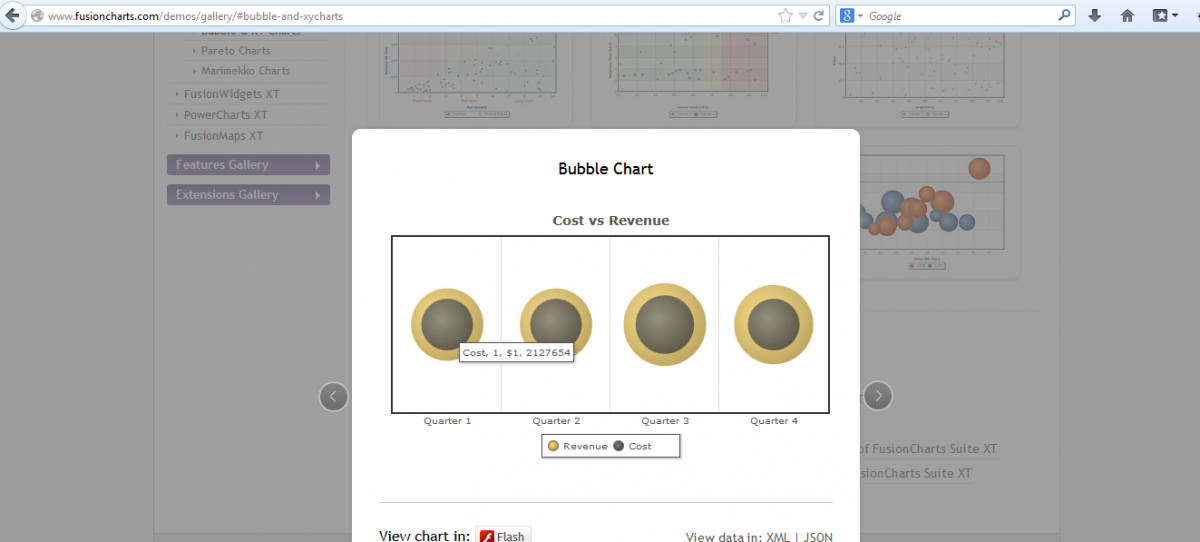
we are using this bubble chart (screenshot attached).
On hover, the tooltip says "Cost , 1, $1 , 2127654".
What's the relevance of 1 and $1 here?
The 2127654 figure is ok. That represents the cost.
Is there any way we can hide the "1, $1" part?
regards,
Sumant
-
Thanks.
This is the attachment.,
-
Hi Folks,
is it possible to show multiple waterfall charts within a single chart?
The waterfall I am attempting is this:
( a ). Increase due to more # Handsets sold
( b ) Increase due to higher average handset price
( c ). Total Increase
Here the numbers ( a ) and ( b ) add up to ( c )
I am able to display like the example shown here:
http://www.fusioncha...?id=waterfall_5
But i need to display this waterfall chart for more than one dealers. Need to show ( a ), ( b )and ( c ) for more than one dealers.
How do I achieve this?
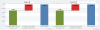
The screenshot attached is sort of where i need to get.
At the moment, they are implemented as 2 different waterfall charts that i show side by side.
regards,
Sumant

is this possible in multi-axis charts
in Using PowerCharts XT
Posted · Report reply
I have a multi-axis chart... i show various metrices as lines on the chart. each metric has its own axis (since their scale and range are very different).
Time is the common x-axis.
Now I need to show the lines to appear as a dashed line towards the end... ie. towards the right side of the line... these are the forecast values. The actual values should be in a solid line..
Is this possible?