
Valeriy
-
Content count
17 -
Joined
-
Last visited
Posts posted by Valeriy
-
-
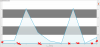
but why line border can not see? possible control separately lineThickness for chart and lineThickness for border? just chart looking back without border(((
-
Good day
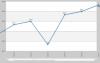
 ! possible chart's position on X or Y? because i need on Y move one chart in few pixels, or zero position scale move in down (somehow
  )
) -
Any ideas? because i not have idea

-
can show XML and SWF?
-
so basically i am using an xls file to generate my graphs with fusion charts..
my xls file has roughly 4400 lines/set of variables to create the chart.. which shows data over a month's worth of time..
this file is being updated every hour via a cronjob , however I can't get the chart to display all the data...at around 5+ days worth of data.. the charts simply crash and show "no data to display"
if i add it manually all the data shows correctly..
any suggestions?
as an option if you have the source code (fla and com folder with classes), split into 2 parts XML and load consistently or make 2 diffirent chart
-
Hi,
Can you please paste your chart XML here?
yes, look please and SWF file what i need
-
I like that fusionchart, can build whatever you like, respect FusionChart and Team
-
Hi,
1. Could you please confirm if you are looking for plotting the same data against both Primary (left) and Secondary (Right) axis?
In case yes, you would need to provide similar data for both the Area and the Line plots for both the axes.
2. Also, in case you are trying to display the data that is currently on the primary axis to show on the secondary axis, instead of what is displayed now, please try setting "parentYAxis='S'" for the Area plot. The "Line"{ plot would be plotted against the left axis at this point.
Ex:
<dataset ... renderAs='LINE' >
  	...
     </dataset>
     <dataset ... renderAs='AREA' parentYAxis='S' >
  	...
     </dataset>
If we are unable to comprehend your query and the above reply is not what you are looking for, please specify your requirement a bit elaborately so that we can assist you further.
Hope this helps.

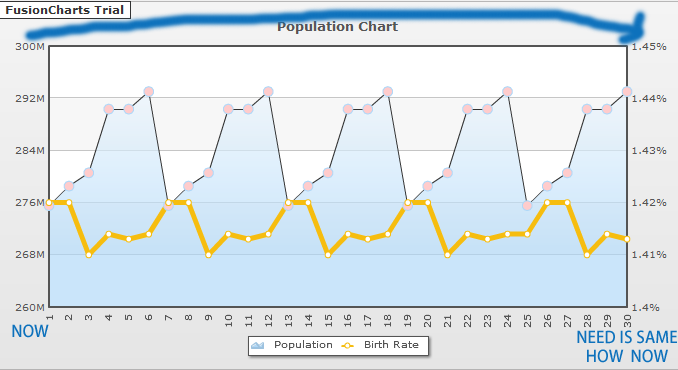
Yes, thanks, good, and again prblem with chart, look images please, why i see chart how polyhedron? how i can remove line (red cross)
Thanks
-
Hi,
Of course! Please use anchorColor and AnchorRadius attributes.
Example:
anchorColor='ff0000' anchorRadius='10'
Thanks a lot, but i have any question, i need output display data how and left side
look screenshot please in attache, possible?
i want just duplicate left and right data is same
-
yes, its working, thanks, but color - white, can i change color anchor and size anchor?
-
for 2D Dual Y Combination Chart how i can add display anchor for Area chart? if in xml renderAs = "Line", then we can see anchor, but i need show anchor also for xml param renderAs = "Area", let me know, how i can?
-
I have 2 or 5 line in chart (with positive and negative values), i need set rendering all chats with 0 point, possible?
-
Hi,
Could you please try using FusionCharts XT v3.2.2?
We have released a new version of FusionCharts XT v3.2.2 Service Release 4 on 6th, August 2012.
It has many bug fixes and enhancements.
You can get the trial version from here: http://www.fusioncha...ownload/trials/
No, bad idea, i not want use in my project chart with trial text
-
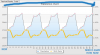
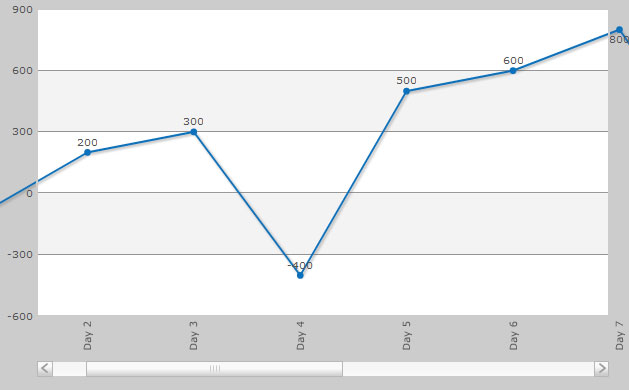
Hello! i use FusionCharts v3 Enterprise, and scroll line 2d chart, i have poblem with scope chart (the screenshot you can see that the lines go beyond the limitations of how to hide them? I want that line does not extend beyond the markup)
-
Hello, i need help, my company buy and send me FusionCharts v3 Enterprise (when buy i not know) and tell me add in Pie3D chart legend and other feature, but i see what Pie3D not supported legend, need buy new version? or where can download new classes and fla for Pie3D with legend? I am upset, please help what need to do?
-
Hello all, i use FusionCharts v3 Enterprise, i need for ScrollLine2DChart hide or dysplay scroll bar via XML file, possible? if possible can you help me?

3D Pie With Slice Value
in General usage
Posted · Report reply
Good day FusionChart lovers i have 3D pie chart, but how i can make display value in slice pie? now all value displayed outside with pieces of chart