
sarvari
-
Content count
8 -
Joined
-
Last visited
Posts posted by sarvari
-
-
I tried, But still hard luck...

-
total_Availablity.html
*******************************************************************************
<html>
<head><title>total_Availablity for 2013-05-16</title></head>
<body>
<object classid="clsid:d27cdb6e-ae6d-11cf-96b8-444553540000" codebase="http://fpdownload.macromedia.com/pub/shockwave/cabs/flash/swflash.cab#version=8,0,0,0" width="850" height="350" id="FusionCharts_1" >
<param name="movie" value="../../../swfs/MSColumn2D.swf" />
<param name="FlashVars" value="&dataURL=total_Availablity.xml&chartWidth=850&chartHeight=350">
<param name="quality" value="high" />
<embed src="../../../swfs/MSColumn2D.swf" flashVars="&dataURL=total_Availablity.xml&chartWidth=850&chartHeight=850" quality="high" name="FusionCharts_1" type="application/x-shockwave-flash" pluginspage="http://www.macromedia.com/go/getflashplayer" />
</object>
</body>
</html>************************************************************************************
total_Availablity.xml
**************************************************************************************
<chart palette='2' caption='Availability report for2013-05-16' xAxisName='Application' yAxisMinValue='90' yAxisMaxValue='100' yAxisName='Availability' showValues='1' decimals='2' formatNumberScale='0' useRoundEdges='1' labelDisplay='Rotate' slantLabels='1' >
<categories>
<category label="AXPECOWeb" />
<category label="CER WEB" />
<category label="EMSWebService" />
<category label="EstatementRTEM" />
<category label="FinancialServices1.x" />
<category label="Fins2 Converge Services" />
<category label="Fins2 Favorite Web" />
<category label="Fins2 Intl" />
<category label="Fins2 US" />
<category label="Finshub4" />
<category label="HorizonWeb" />
<category label="OFX WEB" />
<category label="OfxEnterprise" />
<category label="PDF WEB" />
<category label="RMMWeb" />
<category label="RRShub2" />
<category label="RRShub4" />
<category label="StatementService" />
<category label="TSeC Wave2(On WAS6) " />
<category label="TseC Wave 4" />
</categories>
<dataset>
<set value="100.00" />
<set value="99.03" />
<set value="99.84" />
<set value="99.89" />
<set value="98.05" />
<set value="100.00" />
<set value="99.99" />
<set value="99.96" />
<set value="99.44" />
<set value="97.44" />
<set value="99.97" />
<set value="99.65" />
<set value="99.64" />
<set value="99.27" />
<set value="99.72" />
<set value="100.00" />
<set value="100.00" />
<set value="99.92" />
<set value="100.00" />
<set value="100.00" />
</dataset>
</chart>*******************************************************************************************
-
i attached the code in the text file...its in compatibility_issue .txt
-
Hi
Thanq so much for replying.
i am using the below version
@version fusioncharts/3.2.2-servicerelease1.4200 -
Hi All,
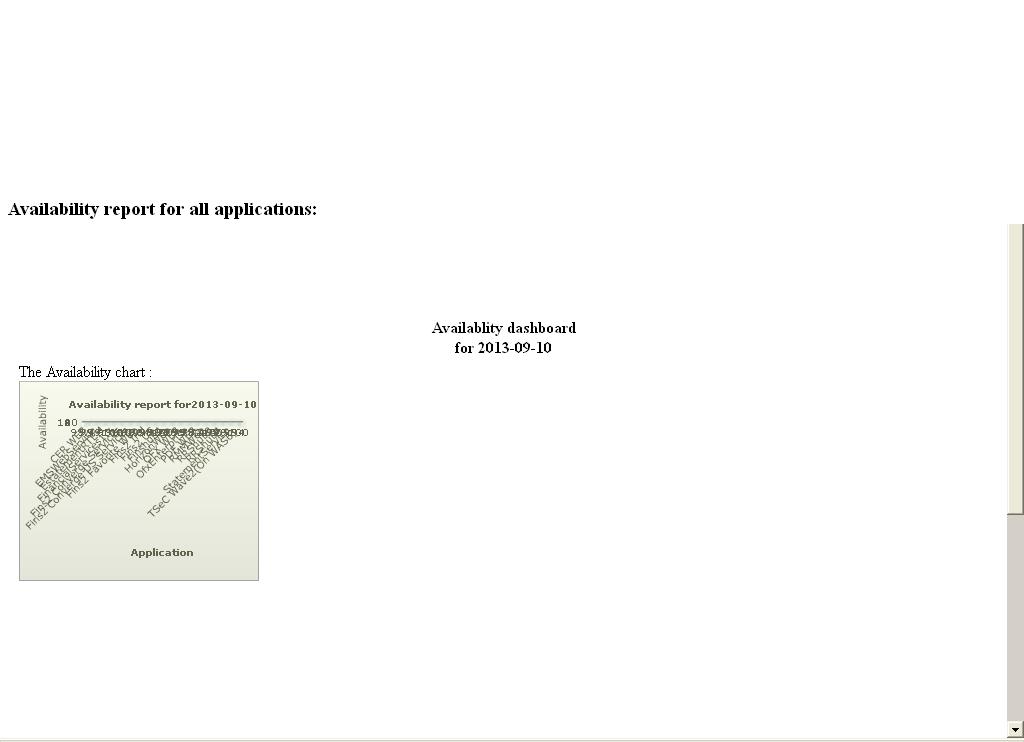
I got a problem...i want to dispaly a chart. It is displaying fine in IE but in mozilla it is displaying very small..I am using the same code for both browsers. I am using IE8 and Mozilla 15 versions. I attached screenshots of how the chart is appearing and the text file of code I am using.. Please help me fix this...sugesstions are deeply awaited...bye.... have a good day all...

-
thank u so much..the problem was solved..
Hi,
A warm welcome to FusionCharts Forum!

Please try using "linkedchart" keyword instead "linkedcharts".
Please find attached illustration for your reference.
Hope this helps!
-
this is my HTML document named weekly-sales.
<html>
<head>
<title>SARVARI</title>
<script type="text/javascript" src="FusionCharts/FusionCharts.js">
</script>
</head>
<body>
<div id="chartContainer">FusionCharts XT will load here!</div>
<div id="childChartContainer" ></div>
<script type="text/javascript">
FusionCharts.setCurrentRenderer('javascript');
var myChart = new FusionCharts( "FusionCharts/Doughnut2D.swf","myChartId", "650", "650", "0", "1");
myChart.setJSONUrl("Dou1.json");
myChart.render("chartContainer");
myChart.configureLink
(
[
{
swfUrl: 'FusionCharts/Bar2D.swf',
width: '350', height: '350',
renderAt: 'childChartContainer',
insertMode: 'append',
overlayButton: {message: 'Close' }
}
]
);
</script>
</body>
</html>
and this is my JSON document: "Dou1.json"
{
"chart": {
"showlegend": "1",
"showlabels": "0",
"showvalues": "0",
"issmartlineslanted": "0",
"numberprefix": "$",
"plotbordercolor": "FFFFFF",
"showpercentagevalues": "0",
"bgcolor": "FFFFFF,CCCCCC",
"caption": "Spend by Categories"
},
"data": [
{
"alpha": "60",
"color": "99CC00",
"label": "Food",
"value": "212000",
"link":"newchart-json-bar1"
},
{
"alpha": "60",
"color": "333333",
"label": "Entertaiment",
"value": "96800",
"link":"newchart-json-bar2"
},
{
"alpha": "30",
"color": "99CC00",
"label": "Sales",
"value": "26400",
"link":"newchart-json-bar3"
},
{
"alpha": "30",
"color": "333333",
"label": "Others",
"value": "29300",
"link":"newchart-json-bar4"
}
],
"linkeddata":[
{
"id":"bar1",
"linkedcharts":{
"chart": {
"bgcolor": "FFFFFF,FFFFFF",
"caption": "Activity by Card",
"useroundedges": "1",
"tooltipbgcolor": "E7EFF6",
"tooltipbordercolor": "114B78",
"basefontcolor": "114B78",
"alternatevgridcolor": "AFD8F8",
"subcaption": "(supp)"
},
"data": [
{
"color": "AFD8F8",
"label": "JohnSmith",
"value": "100.00"
},
{
"color": "F6BD0F",
"label": "AnnaSmith",
"value": "405.00"
},
{
"color": "8BBA00",
"label": "Kevin Brown",
"value": "210.00"
},
{
"color": "A66EDD",
"label": "All Others",
"value": "75.00"
}
]
}
},
{
"id":"bar2",
"linkedcharts":{
"chart": {
"bgcolor": "FFFFFF,FFFFFF",
"caption": "Activity by Card",
"useroundedges": "1",
"tooltipbgcolor": "E7EFF6",
"tooltipbordercolor": "114B78",
"basefontcolor": "114B78",
"alternatevgridcolor": "AFD8F8",
"subcaption": "(supp)"
},
"data": [
{
"color": "AFD8F8",
"label": "Smith",
"value": "100.00"
},
{
"color": "F6BD0F",
"label": "Smith",
"value": "405.00"
},
{
"color": "8BBA00",
"label": "Brown",
"value": "210.00"
},
{
"color": "A66EDD",
"label": "All Others",
"value": "75.00"
}
]
}
},
{
"id":"bar3",
"linkedcharts":{
"chart": {
"bgcolor": "FFFFFF,FFFFFF",
"caption": "Activity by Card",
"useroundedges": "1",
"tooltipbgcolor": "E7EFF6",
"tooltipbordercolor": "114B78",
"basefontcolor": "114B78",
"alternatevgridcolor": "AFD8F8",
"subcaption": "(supp)"
},
"data": [
{
"color": "AFD8F8",
"label": "John",
"value": "100.00"
},
{
"color": "F6BD0F",
"label": "Anna",
"value": "405.00"
},
{
"color": "8BBA00",
"label": "Kevin",
"value": "210.00"
},
{
"color": "A66EDD",
"label": "All Others",
"value": "75.00"
}
]
}
},
{
"id":"bar4",
"linkedcharts":{
"chart": {
"bgcolor": "FFFFFF,FFFFFF",
"caption": "Activity by Card",
"useroundedges": "1",
"tooltipbgcolor": "E7EFF6",
"tooltipbordercolor": "114B78",
"basefontcolor": "114B78",
"alternatevgridcolor": "AFD8F8",
"subcaption": "(supp)"
},
"data": [
{
"color": "AFD8F8",
"label": "JS",
"value": "100.00"
},
{
"color": "F6BD0F",
"label": "AS",
"value": "405.00"
},
{
"color": "8BBA00",
"label": "KB",
"value": "210.00"
},
{
"color": "A66EDD",
"label": "All Others",
"value": "75.00"
}
]
}
}
]
}
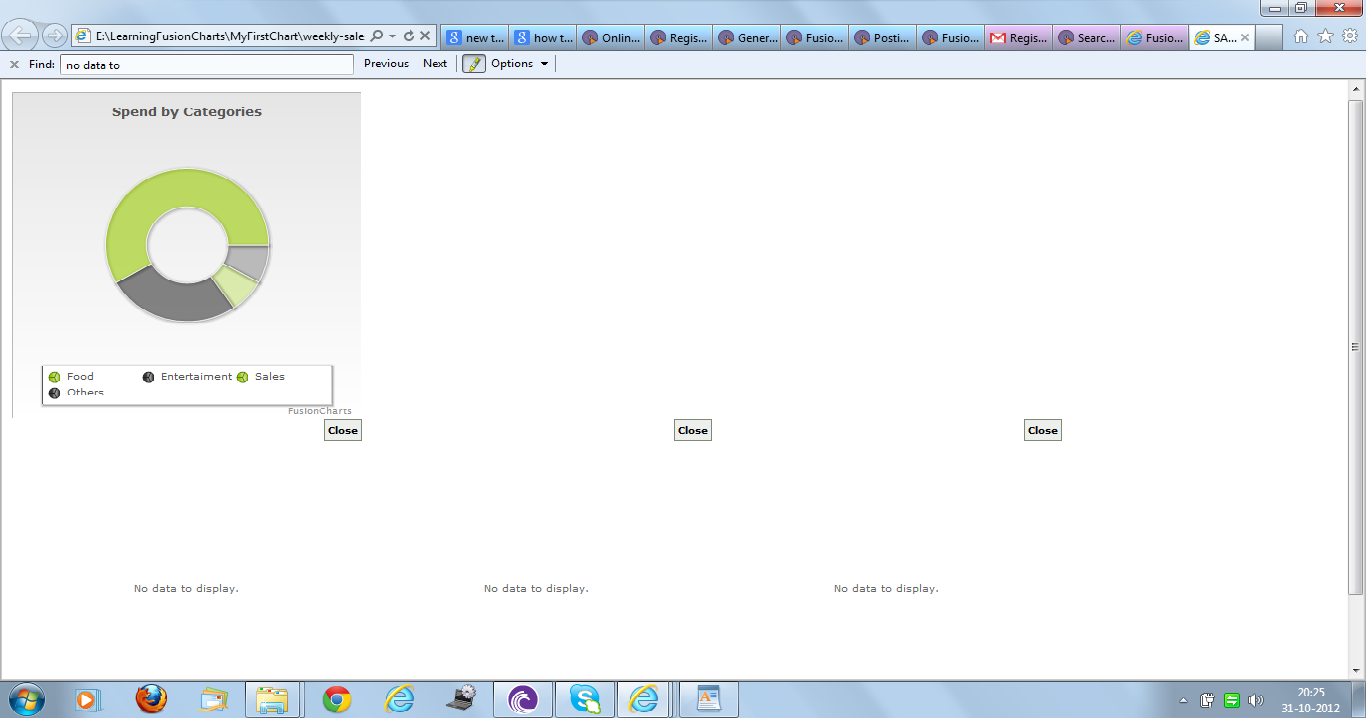
the main chart was displaying but when we click on the mainchart the child chart was not displaying.i am attaching the screen shot of it.can anyoone plz help me how to make child chart display.thanks in advance.


compatibility issue between IE and mozilla
in Miscellaneous
Posted · Report reply
OMG!!! its working...thank you so much...i am relieved...Thanq @sumedh too..