
markrichter
-
Content count
3 -
Joined
-
Last visited
Posts posted by markrichter
-
-
I'm having a similar issue (using v3.2) only for the iPhone and iPad (desktop Flash output works fine) - in troubleshooting, I ended up creating this test page with only the chart and the offending file reference (to jquery-1.9.0.min.js, which on my "real" page is being referenced for a jQuery slider that I'm using); http://test.travelhq.com/cp/ctsDemo/samples/promotional/weekly-sales.html. So, when I remove the reference to jquery-1.9.0.min.js this works fine on an iPad; but when that reference is there, the bar graphs do not load. So there must be some sort of conflict, but I can't figure out how to resolve it. Any ideas?
-
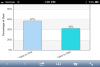
I am new to FusionCharts, but I'm part of a team that has worked with them a lot, and they are all stumped on this. I have set up a little test chart with non-dynamic data, and on the javascript version on an iPad or iPhone, the labels on the X-axis are slanted, but I do not want them to be. It's fine in the Flash output version. This is using version 3.2.1. I've tried all of the things that are supposed to work per the documentation (such as labelDisplay, slantLabels, etc.) Demo url is http://www.travelhq.com/cp/test/fusion/weekly-sales.html. Current xml code is as follows:
<chart numberSuffix='%' showSum='1' decimals='0' useRoundEdges='1' yAxisName='Percentage of Goal' bgAlpha='0' bgcolor = 'ffffff' bgangle='0' canvasBgAlpha='100' yAxisMinValue = '0' yAxisMaxValue = '100' showLabels='1' baseFont = 'arial' baseFontSize = '16' plotSpacePercent = '60' showBorder = '0' showToolTip='1' >
<set label='Wholegoods
$37,163 Sales to Date' value='57.35' />
<set label='Parts
$8,694 Sales to Date' value='42.75' color="2ad8e3"/>
</chart>
Any help is greatly appreciated! Thank you.
Mark

jQuery Conflict?
in Javascript Problems
Posted · Report reply
I have to preface this with the fact that I am not a Javascript or jQuery whiz (I'm more of a designer) ... however, I have worked with FusionCharts before with no issues. I am on v3.2 and the desktop version works fine, but I'm having problems with the non-Flash (jQuery) output for iPhones/iPads; the chart appears and the percentage text appears, but the bar graphs themselves do not load or animate. Independent of the FusionChart, I am also referencing jquery-1.9.0.min.js, which is being utilized for a slider that I'm using on the same page. In troubleshooting, I ended up creating this test page with only the chart and the offending file reference to jquery-1.9.0.min.js; http://test.travelhq.com/cp/ctsDemo/samples/promotional/weekly-sales.html. So, when I remove the reference to jquery-1.9.0.min.js this works fine on an iPad; but when that reference is there, the bar graphs do not load. There must be some sort of conflict with 1.9.0, but I can't figure out how to resolve it. Any ideas?
Mark