
roberkules
-
Content count
2 -
Joined
-
Last visited
Posts posted by roberkules
-
-
I get the error message "Invalid data." shown in charts on IE8 if there's no flash (or an outdated version). The chart works fine on IE8 if flash is installed and on Chrome, FF, Safari regardless if it uses flash or javascript.
I downloaded FusionCharts XT (3.2.4-sr1.9888) and changed the "Multi Series Column 2D Chart" demo to reproduce the issue on IE8.
FusionCharts_XT\Gallery\Column2D\MSCol2D1.html
changed from
chart.setXMLData( dataString );
to:
chart.setJSONData({
   "styles": {
       "definition": [
           {
               "color": "000000",
               "isHTML": "1",
               "type": "font",
               "name": "ToolTipStyle"
           }
       ],
       "application": [
           {
               "styles": "ToolTipStyle",
               "toobject": "ToolTip"
           }
       ]
   },
   "chart": {
       "baseFontColor": "979797",
       "showAlternateColorBands": "FFFFFF",
       "showalternatehgridcolor": "1",
       "plotgradientcolor": "",
       "numDivLines": "5",
       "showplotborder": "0",
       "alternateBandColor": "FFFFFF",
       "xaxisname": "",
       "bgColor": "FFFFFF",
       "anchorBgColor": "4D3B62",
       "anchorBorderThickness": "2",
       "chartBottomMargin": "5",
       "anchorRadius": "6",
       "showToolTipShadow": "1",
       "connectNullData": "1",
       "alternateVGridColor": "f1f1f1",
       "toolTipBgColor": "FFDB4A",
       "anchorBorderColor": "FFC322",
       "divLineColor": "e1e1e1",
       "palette": "0",
       "showExportDataMenuItem": "1",
       "chartTopMargin": "10",
       "numberPrefix": "$",
       "numberSuffix": "",
       "useroundedges": "0",
       "showvalues": "0",
       "caption": "",
       "toolTipBorderColor": "CBA31D",
       "showAlternateVGridColor": "1",
       "alternatehgridcolor": "fafafa",
       "showshadow": "0",
       "canvasBorderColor": "DFDFDF",
       "xAxisNamePadding": "15",
       "formatnumberscale": "0",
       "showborder": "0",
       "decimals": "0",
       "yaxisname": "",
       "canvasbgColor": "FFFFFF"
   },
   "categories": [
       {
           "category": [
               {"label": "12 am"},
               {"label": "1 am"},
               {"label": "2 am"},
               [{
                   "dashGap": "2",
                   "color": "FF0000",
                   "dashed": "1",
                   "thickness": "2",
                   "vline": "true",
                   "dashLen": "5",
                   "alpha": "60"
               }]
           ]
       }
   ],
   "dataset": [
       {
           "seriesname": "Today",
           "color": "4D3B62",
           "data": [
               {
                   "tooltext": "Total value of transaction: $50",
                   "value": 50
               }
           ],
           "anchorbordercolor": "008040"
       },
       {
           "seriesname": "21-day avg.",
           "color": "FFC322",
           "data": [
               {
                   "tooltext": "Total value of transaction: $10",
                   "value": 10
               },
               {
                   "tooltext": "Total value of transaction: $20",
                   "value": 20
               }
           ],
           "anchorbordercolor": "FF8040"
       }
   ]
});
this is a screenshot from IE9 (without flash) -> working
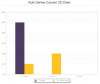
on IE8 (without flash) -> "Loading chart. Please wait"
any help appreciated.

Issue With Fusioncharts 3.2.4 Sr1 On Ie8 And Javascript Renderer
in Javascript Problems
Posted · Report reply
Nobody?
(For now we decided to show a notice to the user if there's no Flash and it's an IE8. But that shouldn't be the solution.)