
KOR
-
Content count
13 -
Joined
-
Last visited
Posts posted by KOR
-
-
Hey Rahul,
I try it on the DEV environment with Collabion V2.0.2.0.
And unfortunately there is also the same behavior!?
(see attached screenshots)
I saw at your screenshot that you might not reproduce my starting point... I use a webpart page where it is possible to place two charts in a row and they share the available space (depends on browser windows size) fity-fifty.
I guess that you entered fix width values, right?
Thanks, KOR


-
Hi I use the following versions:
Collabion 1.1.8.0
SharePoint Server 2010
For the charts which are placed in a row we use a Webpart Page that offers a horizontal Weppart-Adding area (see pic).Unfortunately we had a problem with the V2 of Collabion... it was a little mess, no chart was compatible anymore and we are still at V1 after restore old version back
Regards, KOR
-
Problem still exists...
...how should I select Collabion as a reporting tool that does not work on Dashboards?
I also research for a dashboard (multiple charts on one page) chart gallery at www.collabion.com - I couldn’t find any only FusionCharts are presented as dashboard pages.
Is this maybe a known issue?
-
Hi,
I use collabion for reports and dashboards.
For sure it's a mandatory requirement to visualize multiple charts on one single SP page - to make it possible for specific people to direct the business in regard to the needs.
My issue is not that much the performance as the spacing issues.
It seems to me that if I have two reports on one single row (leave dynamic width) that a fight between the reports is starting.
Normally I would expect that every charts should use 50% of the page size. On Page load this is true, but if I click on a chart the clicked Chart gets 70% of space.
Do anybody have experience with such a behavior like this?
THX
KOR

-
Hi Rahul,
thank you!
-
Hi Guys,
I'm wondering every time since I've start collabion why there is no Stacked Colum 2D(!!) + Line Dual Y-Axis chart type?!
Okay, in 3D it is existing buuut how horrible does it look like in a dashboard where all other charts are setup in 2D?
Is it planned to implement this chart type - can someone note it on a wish list?
THANK YOU
KOR
-
Hi,
I have a already in place chart that use as data source a Sharepoint List.
However I make a change to that list - I add an additional column with the result that the whole page was not accessible an error message occurs (?!).
I start immediatelly troubleshooting...after I delete the new created column the error disappears and the page was again accessible.
Why it is not possible to add new columns to a Sharepoint list which is already in use by a Collabion chart?
In my opinion it's a limitation for maintenance or update of charts and reports!
-- --
Why adding columns to a list?
Because the current list could be used for more than one chart if I add one more column.
Regards, KOR
-
Hi Kor,
Thanks for explaining it. The exact use case for the multi-level drill down is in our list and we'll try to add this in the next major release.
Hi Rahul,
sounds good!
When is the major release planed?
# See also a Fusion Chart live demo of multi level drill down:
-
Hi Kor,
I am afraid, it is not supported in Collabion Charts for SharePoint as of now.
Hi Rahul,
it is unfortunate that this feature is not implemented.
BecauseI wanted to use this function within a service desk web front end Sofware (ticket management) by opening a link out of the chart.
( http://www.random-service-desk-web-front-end.net/ticket.php#12345678 --> number on end is th non static part)
I know that this function is not a "must have" accessory for a chart tool, but possibly a enrichment for collabion chart.
Thanks,
KOR
-
Hi,
I am afraid, this is not implemented.
Could you please share your idea how exactly multi-level drill down should work? I mean what type of data do you have which can be used for multi-level drill-down?
Hi,
first thank you for fast response.
I will use the country/cities chart example from the Collabion video examples.
- 1st level countries
- 2nd level Cities
- 3rd level could be business departments located on this city of 2nd level
- 4th level could be departments members of business departments 3rd level
- 5th ...
I would welcome if the wizard give me the possibility to use more than one drilldown chart.
So it gives me the posibility to offer rough and detailed information depending on the requirements of the user.
This also means that I could offer one chart for Management purposes (need facts/general results) and random users (need detailed facts/results) would be able to drill down the results as they want.
I hope I could give you a look into my thoughts.
Regards,
KOR
-
Hi,
I'm in a evaluation phase of collabion chart and I will identify if Colabion fits to our requirements.
I have already a question:
Is it possible to open a webpage that includes (!)single column information - something like a weblink building?
Example:
Column text content : "wikipedia"
By Click on column following link will be opened = www.google.de/search?q=wikipedia
Thank you in advance for support.
Kind regards,
KOR
-
Hi Brant,
Collabion uses LinkedCharts feature for Drill Down but that is just single level drill-down.However, We have added this request in product's wishlist.
Hi Rahul Kumar,
is there any news regarding the multi level drill down, is this or will this functionality be implemented?
If yes when?
Thank you in advance,
KOR
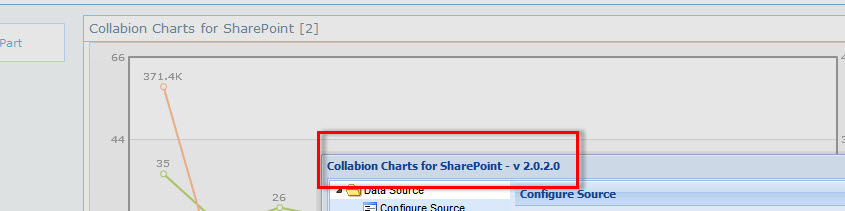
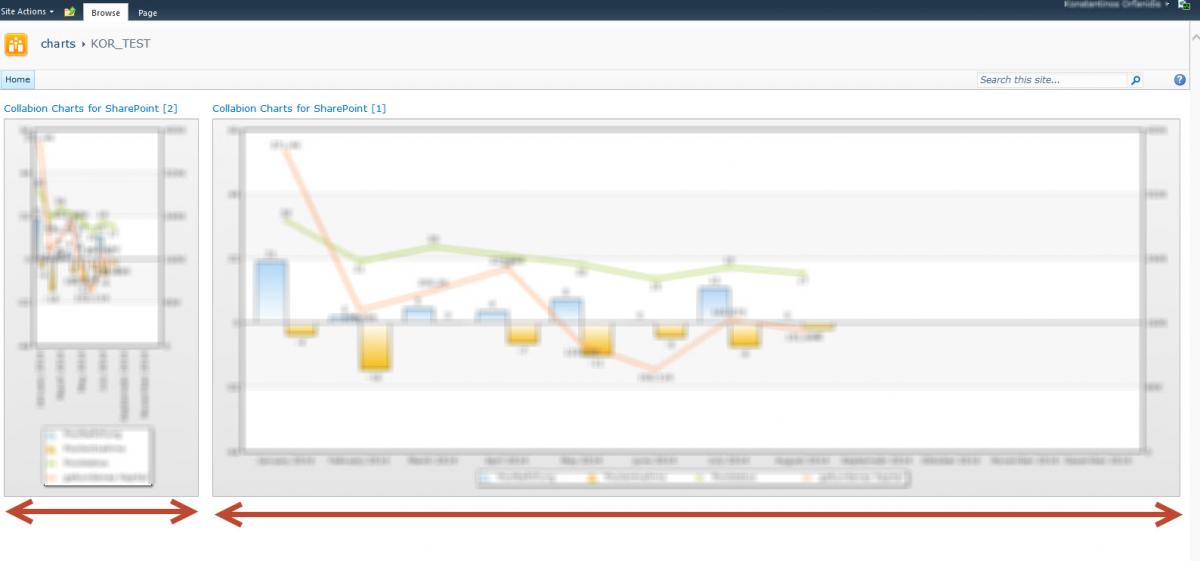
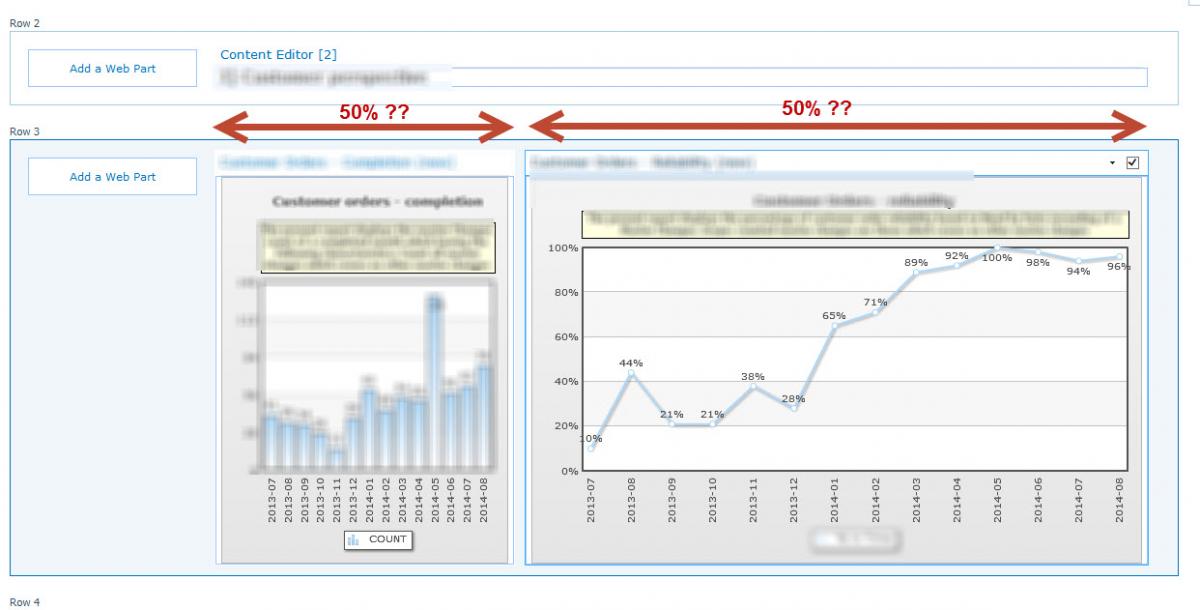

Chart performance issues on dashboard page
in Collabion Charts for SharePoint
Posted · Edited by KOR · Report reply
BTW: On Load of page the Charts do correct share the space - only after one click on a chart the ratio moves to a 30-70 and another click the ratio goes to 20-80 ratio
Update: This ratio conflict happens also on random Wiki pages if i dont use fix width values like on a table ... when I use a table (one row - two columns) and set the table width on 100%