
Haritha
-
Content count
489 -
Joined
-
Last visited
Posts posted by Haritha
-
-
Hi Jacob,
Welcome to FusionCharts Forum

It is not possible format legend to have columns to show label and values, as of now. Also, it is not possible to use external tags like span to format it using CSS too.
However, if you want to show legend data in the form of tabular format to show label in the first column and value in the second, then you may use Grid Component from the FusionCharts XT pack. You may disable showing of legend in your chart, by setting the attribute "showLegend" to 0 and then use Grid component in the desired position.
FusionCharts XT Grid Component helps you display Single-series FusionCharts XT data in a tabular format. You can combine the grid component with any chart to form a good looking combo. Please have a look at this component at http://docs.fusioncharts.com/charts/contents/index.html?grid-component/Grid_Overview.html
Hope this helps.
-
Hi,
Could you please attach your complete JSON data here so that we can test it further?
Awaiting your response.
-
-
Hi,
Welcome to FusionCharts forum.
FusionCharts shows anchors as a rotated square to make it appear like a diamond when anchor sides is set to 4. This is the current functionality and it is not possible to rotate the anchor to make it look like a square on the chart.
Hope this helps.
-
Hi,
This attribute works fine using your JSON data too using the latest version of FusionCharts v3.3.1 SR3.
Please check if you are using the latest version. If not, you may download a trial copy of the same from http://www.fusioncharts.com/download/ and check it again.
Hope this helps.
-
Hi,
As said above, it is not possible to add a link on x-axis label to make it call a JavaScript function when a user clicks on it.
However, you may add links to data plots (columns) such that a JavaScript function gets called when a user clicks on the particular data plot.
For more information on adding JavaScript function as link on data plot, refer: http://docs.fusioncharts.com/charts/contents/index.html?DrillDown/JavaScript.html
Also, for a demo of the same, refer: http://docs.fusioncharts.com/charts/Code/DrillDown/JSExample.html
Hope this helps.
-
Hi,Due to security and performance reasons, support for HTML tags like anchor tags defined within X-axis labels has been dropped. So, this feature will not be available for the current version v3.3.1 SR3 as well.The using of anchor (<a> tag) inside label for having links was a workaround provided to address the requirement to have links on x-axis labels in older versions of FusionCharts. This workaround does not work anymore, since we have made the charts more restrictive to external tags due to security constraints.Hope this helps.
-
Hi,
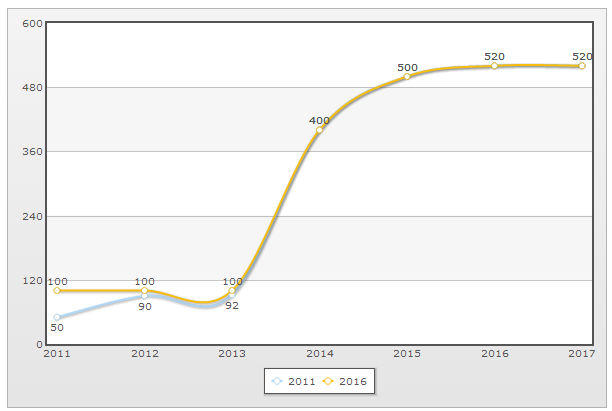
The attribute "valuePosition" has to be used at the set level.
Ref.
<set .. valuePosition='BELOW' />
Please find an attached XML created according to your chart in the screenshot and a screenshot of the chart obtained using the XML.
Hope this helps.
-
-
Hi,
FusionCharts shows context menu (menu visible on right-click on the chart) only in its Flash variant and JavaScript variant of FusionCharts does not support context menu.
If you want to export chart to image/PDF/SVG then you need to use the export icon visible on the top right corner of the chart. To export the chart using this export icon, set the attribute "exportEnabled" to "1" of chart element and remove the other export attributes.
Alternatively, if you do not want user to export the chart but the export to happen on click of a button, then you may obtain the DOM ID of the chart and call the "exportChart()" method of FusionCharts JavaScript API in the JS function called on click of this button.
Ref.
<chart ... exportEnabled='1' >
In JS function:
FusionCharts("chartId").exportChart( { exportFormat : 'PDF'} );
Hope this helps.
-
Hi Senthil,
This problem seems to be specific to the third-party library (html2pdf,Dompdf etc) that you are using to convert HTML page to PDF file.
We suggest you to use wkhtmltopdf/PhantomJS to convert your entire page to PDF along with other contents like image,text,etc and FusionCharts. These libraries can be used even after rendering the chart on a browser.
For implementing them in your sample, refer the blog post : http://blog.fusioncharts.com/2013/03/how-to-save-charts-as-images-at-server-side/
Hope this helps.
-
Hi,
Could you please attach a sample here so that we can check the problem with jQuery Popover, at our end?
Awaiting your response.
-
Hi,
Could you please send us a screenshot of the URL being accessed from your browser? Also, please check if you see any error in the console of IE 9. (To view the console, go to Tools- Developer tools- Console).
Awaiting your response.
-
Hi,
Are you trying to obtain the attributes of <circle> element from SVG data of chart? If yes, then you may try using the below given code :
var xmlStr=$("#chartContainer").html();
var xmlObj=( new window.DOMParser() ).parseFromString(xmlStr, "text/xml");
var y = xmlObj.getElementsByTagName("circle")[0];
alert(y.getAttribute("fill")); // obtain other attributes in the similar way
You may obtain the other attributes of "circle" element like "cx","cy","stroke" etc in the similar way.
Hope this helps.
-
-
-
Hi,
Welcome to FusionCharts Forum.
Do you want to obtain the XML data of the chart in HTML DOM and then obtain the series name of the dataset of chart ? If yes, please check if the below given code suits your requirement:
var xmlStr=FusionCharts("myChartId").getXMLData();
var xmlObj=( new window.DOMParser() ).parseFromString(xmlStr, "text/xml");
var y=xmlObj.getElementsByTagName("dataset")[0];
alert(y.getAttribute("seriesName"));
The code snippet given above finds the DOM of the chart, and then uses the DOM parser of window to convert the XML string into an XML object. Then, you may obtain the tag that you are searching for and retrieve its attributes. The above code alerts the series name of the first dataset element in a Multi-series chart.
Awaiting your feedback.
-
Hi,
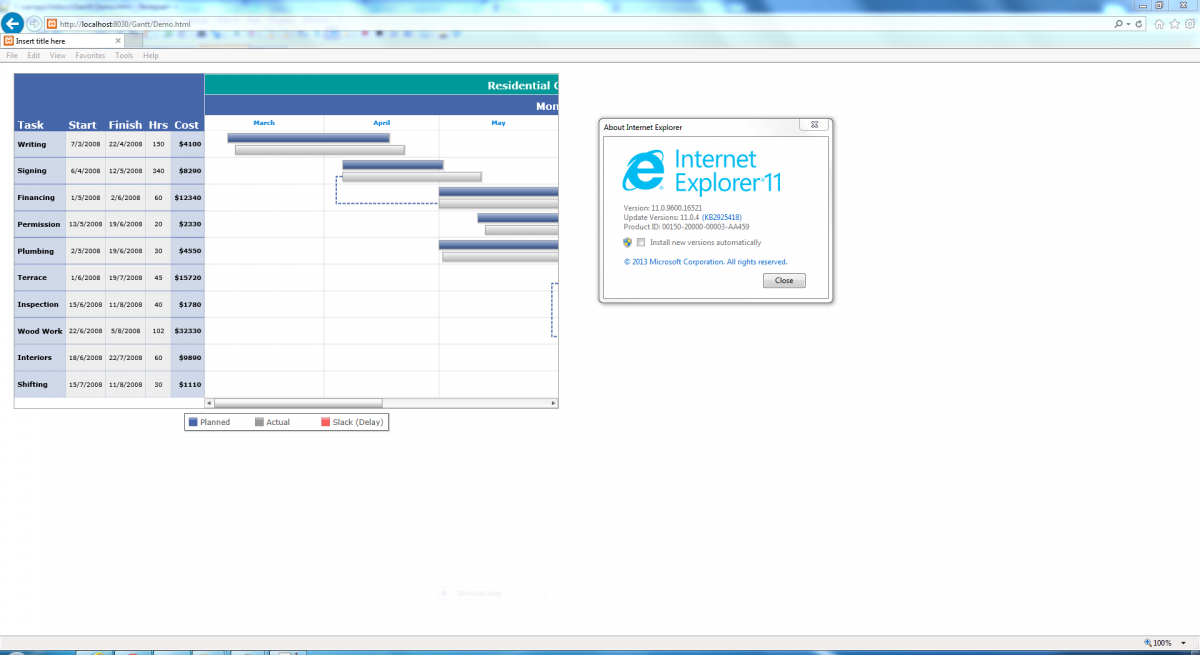
Please try running your sample after deploying it on a server and check again. The URL should be an IP of server or a localhost if your server is present on the same machine. Please refer the attached screenshot.
You are able to see the chart fine on IE 10 since as said in the previous post, Internet Explorer browser restricts JavaScript from accessing local file system owing to security reasons in IE 11 and this restriction is not present in other versions of IE.
Hope this helps.

-
Hi,
Many browsers restrict JavaScript from accessing local file system owing to security reasons. The JavaScript charts, when running locally, will not be able to access data provided as a URL (setXMLUrl/setJSONUrl). If you run the files from a server, it will run absolutely fine, though. When running locally, however, if you provide the data as string (using the Data String method), it works fine. For information on this, you may refer the documentation link : http://docs.fusionch...singPureJS.html
Hence, please try running the sample from a server and check it again.
Hope this helps.
-
Hi,
We could replicate the problem and are investigating more on it.
We shall get back to you with the results soon.
-
-
Hi Mauro,
Welcome to FusionCharts Forum
We have checked the sample and found that the problem seems to be that the "chartContainer" Div does not resize itself according to its container "layout" Div. To avoid this problem, please try replacing the Divs in your page with the following code :
<div id="layout" class="big">
      <div id="chartContainer" style="width:100%;height:100%">chart</div>
</div>
By doing this, you are setting the width and height of "chartContainer" to occupy 100% of its container Div. So, when you modify the dimensions of "layout" Div in your CSS, the dimensions of "chartContainer" change too.
Hope this helps.
-
Hi,
This problem has already been detected as a bug at our end. Our developers are working towards fixing it.
We shall update this thread about further developments.
-
Column chart data labels alignment
in General usage
Posted · Report reply
Hi,
Please let us know if you are using Flash charts or JavaScript charts.
The mis-alignment of values seems be due to the reason that that chart width is less to accommodate the data plots present. Try increasing the width of the chart and also try changing the value of "plotSpacePercent" attribute of your chart.
If this does not help, then please attach your XML/JSON data here so that we can check the same at our end and suggest you accordingly.
Awaiting your feedback.