
MatiasLaino
-
Content count
10 -
Joined
-
Last visited
Posts posted by MatiasLaino
-
-
Hi,
What FusionCharts version are you using?
@version fusioncharts/3.2.4-sr1.9888<br style="color: rgb(107, 107, 107); font-family: verdana, arial, tahoma, sans-serif; line-height: 18px; background-color: rgb(247, 247, 247);">Javascript
-
Hi, sorry but this is for an application for my company's client, and I'm not free to share a public URL with anyone outside the company
 Anything else I can provide you?
Hi,
Welcome to FusionCharts Forum!

Can you please share a live of the same URL with us?
-
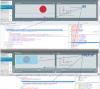
Hello, my problem is that when rendering a chart (Pie Chart / Bar Chart), the inline CSS created by the render is very different in Chrome (or FF) and Internet Explorer.
In Chrome/FF, the chart inherits correctly the width value of its parent of 55%, but on IE9 (and 8) it renders a css width of 1056 px; we have no idea where this value is coming from and require assistance.
Attached screenshot showing the rendered HTML and CSS.
-
Unfortunately I was wrong, the problem still persists, even with no margin attributes.
-
The issue was resolved by removing some attributes from the chart, probably misusage
Thanks.
-
Hey,
Can you please provide us with few more information to look into the issue further?
>>FusionCharts version
>>Charts are rendered as Flash/JavaScript
>>Sample code
>>Any screenshots
@version fusioncharts/3.2.4-sr1.9888
Javascript
HTML already posted, some sample JS of how it is rendered:
var oldTaskChart = new FusionCharts({ id: "chart_task", debugMode: "1" });
if (oldTaskChart && oldTaskChart.dispose) {
oldTaskChart.dispose();
}
// tasks object
var tasks = {
all: [],
onTrack: [],
atRisk: [],
offTrack: [],
complete: [],
notStarted: []
};
// validate filtered tasks
if (!filteredTasks || !$.isArray(filteredTasks)) {
throw "Tasks chart has invalid arguments.";
return;
}
// validate chart name
if (!chartName) {
chartName = "All Workstreams";
}
// categorize the tasks
$(filteredTasks).each(function () {
switch (this.Status) {
case 0:
tasks.offTrack.push(this);
break;
case 1:
tasks.atRisk.push(this);
break;
case 2:
tasks.complete.push(this);
break;
case 4:
tasks.onTrack.push(this);
break;
default:
tasks.notStarted.push(this);
break;
}
tasks.all.push(this);
});
//fix pie chart bug if value == 0 convert to null
var onTrackTaskValue = (tasks.onTrack.length == 0) ? null : tasks.onTrack.length;
var atRiskTaskValue = (tasks.atRisk.length == 0) ? null : tasks.atRisk.length;
var offTrackTaskValue = (tasks.offTrack.length == 0) ? null : tasks.offTrack.length;
var completeTaskValue = (tasks.complete.length == 0) ? null : tasks.complete.length;
var notStartedTaskValue = (tasks.notStarted.length == 0) ? null : tasks.notStarted.length;
// chart data
var chartData = '<chart showLabels="0" showValues="0" showLegend="0" pieRadius="68" legendBgAlpha="0" chartrightmargin="8" charttopmargin="75" chartbottommargin="45" legendPosition="right" chartleftmargin="30" bgcolor="d6dddf" bgalpha="70" bordercolor="d6dddf" basefontcolor="black" basefontsize="11" showpercentvalues="1" bgratio="0" startingangle="360" animation="1" >\n\
<set value="' + onTrackTaskValue + '" label="On Track" color="33CC66" link="javascript:programHealth.displayTasksList(\'tasksChartItem\', 4);"/>\n\
<set value="' + atRiskTaskValue + '" label="At Risk" color="CCFF00" link="javascript:programHealth.displayTasksList(\'tasksChartItem\', 1);"/>\n\
<set value="' + offTrackTaskValue + '" label="Off Track" color="CC0000" link="javascript:programHealth.displayTasksList(\'tasksChartItem\', 0);"/>\n\
<set value="' + completeTaskValue + '" label="Complete" color="003399" link="javascript:programHealth.displayTasksList(\'tasksChartItem\', 2);"/>\n\
<set value="' + notStartedTaskValue + '" label="Not Started" color="606060 " link="javascript:programHealth.displayTasksList(\'tasksChartItem\', 3);"/>\n\
</chart>';
$(".label_control_tasks").text("TASKS" + " " + chartName);
//define task chart
var TaskChart = new FusionCharts("Pie2D", "chart_task", "165", "170");
// fill chart with data
TaskChart.setXMLData(chartData);
//render task chart
TaskChart.render("taskChart");
// attach tasks data to chart element
$("#taskChart").data("tasks", tasks);
//create legends
this.buildLegendChart($('#tasksLegend'), tasks);
// attach task view all button
this.content.element.find('#taskChartContainer > a.view-all').unbind('click.viewAll').bind('click.viewAll', function (event) {
event.preventDefault();
// display all tasks
self.displayTasksList('tasksChartViewAll', undefined, chartName);
});
-
Closer inspection reveals that the tooltip is getting its visibility set to hidden on mouse over:
<g class="highcharts-tooltip" zIndex="8" visibility="hidden" transform="translate(33,50)" style="visibility: hidden;">
Wtf?
-
The problem is worse than I thought, it not only happens to those in the bottom row, it happens randomly whenever I scroll the view. I suspect it's somewhat related to http://forum.fusioncharts.com/topic/12493-tooltip-problem/, which hasn't received a solution in months, and the poor guy was having the issue in production.
If this isn't resolved, I'll have no choice but to recomment to remove Fusion Charts from the project and look for alternatives
Can I expect help?
Thanks
-
Hello everyone.
I have four different charts, placed on a 2x2 grids, each one in its own DIV. The problem is that, when the charts are initially loaded, those at the bottom row, if it's not visible (scrolled out of sight), will not have working tooltips, or handle click inputs.
This is my HTML:
<!-----MILESTONES CHART----->
<div id="milestoneChartContainer">
<h2 class="label_control_milestones"></h2>
<a class="view-all chart_title" href="#" style="position: relative; top: 35px; right: -384px; z-index: 99;">
VIEW ALL
</a>
<div id="milestoneChart">
</div>
<a class="view-milestones chart_title" href="#" style="position: relative; top: -55px; right: -200px;">
<span>5</span> Milestones Due in the next 14 Days >
</a>
<div id="milestonesLegend" class="chart-legend">
</div>
</div>
<!-----RISK CHART----->
<div class="DEV-risks-chart">
<h2 class="label_control_risk"></h2>
<a class="view-all" href="#" style="position: relative; top: 2px; right: 2px;">
VIEW ALL
</a>
<div>
<ul>
<li id="chartRiskTitle">
TITLE
</li>
<li>
<img src="~/Images/Program-Status-Dashboard-Graphical.png" class="DEV-show-risk-chart" />
</li>
</ul>
</div>
</div>
<!-----ISSUES AGING----->
<div class="issues-aging">
<h2 class="label_control"></h2>
<a class="view-all" href="#" style="position: relative; top: 2px; right: 2px;">
VIEW ALL
</a>
<div id="issues-aging-chart">
PLACEHOLDER FOR CHART
</div>
</div>
<!-----TASKS CHART----->
<div id="taskChartContainer">
<h2 class="label_control_tasks"></h2>
<a class="view-all chart_title" href="#" style="position: relative; top: 38px; right: -404px; z-index: 99;">
VIEW ALL
</a>
<div id="taskChart"></div>
<div id="tasksLegend" class="chart-legend"></div>
</div>
</td>
Any idea what I might do to solve this?
Thanks

Layout Problem In Ie (Width Difference Between Chrome And Ie)
in Javascript Problems
Posted · Report reply
You can see on my first post the screenshots you are requesting, along with the HTML and CSS generated code.