
JerryCRH
-
Content count
19 -
Joined
-
Last visited
Posts posted by JerryCRH
-
-
     Dim connectionString10 As String
        Dim ds10 As New DataSet
        Dim stringxml10 As New StringBuilder
        Dim stringxml11 As New StringBuilder
        Dim stringxml12 As New StringBuilder

        connectionString10 = "Data Source=data;Initial Catalog=DB;User ID=User;Password=aaa"
        stringxml10.Append("<graph caption='Lab Order Turnaround Time' canvasbgalpha='0' bgimagealpha='30' bgimage='rx_photo9.jpg' bgimagescale='100' outCnvBaseFontSize='12' showValues='0' bgcolor='1BAFE0,FFFFFF' canvasbgColor='#F0F8FF' animate='1' PxAxisName='Time' SyAxisName='Total Orders' autoScaling='1'  >")
        Using conn10 As New SqlConnection(connectionString10)

            conn10.Open()
            Dim qry10 As New SqlCommand("select thedate, thehour, ordercount, " & _
           " avgtat " & _
            "from lab_order_tat_vw " & _
            "where thedate = CONVERT(varchar,getdate(),101)", conn10)
            Dim rst10 As SqlDataReader = qry10.ExecuteReader()
            stringxml10.Append("<categories> ")
            While rst10.Read()

                stringxml10.Append("<category label='" & rst10("thehour").ToString() & "' />")
                stringxml10.Append("</categories>")
                stringxml10.Append("<dataset seriesName='AvgTaT' showvalue='0'  color='#0000CD'>")
                stringxml10.Append("<set value='" & rst10("avgtat").ToString() & "' />")
                stringxml10.Append("</dataset>")
                stringxml10.Append("<dataset seriesName='TotalOrders' showvalue = '1' parentYaxis='S' renderAs='Line' style='Anim1' >")
                stringxml10.Append("<set value='" & rst10("ordercount").ToString() & "' />")

            End While
            rst10.Close()
            conn10.Close()

            stringxml10.Append("</dataset>")

            stringxml10.Append("<styles>  <definition> <style name='B' type='animation' easing='bounce' duration='1' /> <style name='Bevel1' type='bevel' angle='0' /> <style name='Anim1' type='animation' param='_xScale' start='0' duration='3' />  	<style name='Anim2' type='animation' param='_alpha' start='0' duration='3' easing='bounce' /> </definition> <application> 	<apply toObject='CANVAS' styles='Anim1, Anim2, Bevel1' /> ")
            stringxml10.Append("<apply toObject='DATAPLOT' styles='Anim1, Anim2, Bevel1, B' />")
            stringxml10.Append("</application> </styles>")

            stringxml10.Append("</graph>")
            'MsgBox(rst10("thehour").ToString)


        End Using
        Literal1.Text = FusionCharts.RenderChart("../FusionCharts/MSColumnline3D.swf", "", stringxml10.ToString(), "AvgTaT", "800", "400", _
         False, True)
I have the following piece of code. I am getting "Invalid Data" message. I know the query returns data. Any help would be appreciated.
-
Here is what I have so far. The error is "invalid data"
Dim connectionString10 As String Dim ds10 As New DataSet Dim stringxml10 As New StringBuilder Dim stringxml11 As New StringBuilder Dim stringxml12 As New StringBuilder connectionString10 = "Data Source=server;Initial Catalog=database;User ID=User;Password=password" stringxml10.Append("<graph caption='Discrepancies by Drug by Month' logoURL='logo_crh.gif' logoposition='CC' logoalpha='20' logoscale='150' xAxisName = 'Drug' showDivLineSecondaryValue='1' showSecondaryLimits='1' showValues='0' animate='1' bgcolor='#006600,#FFFDDD' bgratio='0,100' canvasbgAlpha='0' >") Using conn10 As New SqlConnection(connectionString10) conn10.Open() Dim qry10 As New SqlCommand("select distinct(datepart(month,tdate)) TheMonth9 " & _ "from floorstock_discrepancy " & _ "where tdate >= getdate()-180 group by drug, datepart(month,tdate)", conn10) Dim rst10 As SqlDataReader = qry10.ExecuteReader() stringxml10.Append("<categories> ") While rst10.Read() stringxml10.Append("<category label='{0}'/>", rst10("TheMonth9").ToString()) ' & "' />") End While rst10.Close() conn10.Close() stringxml10.Append("</categories>") conn10.Open() Dim qry11 As New SqlCommand("select count(drug) DrugCount, drug Drug2, convert(varchar,datename(month,tdate)) TheMonth2 " & _ "from floorstock_discrepancy " & _ "where tdate >= getdate()-180 group by drug, convert(varchar,datename(month,tdate))", conn10) Dim rst11 As SqlDataReader = qry11.ExecuteReader() While rst11.Read() stringxml10.AppendFormat("<dataset seriesName='{0}'>", rst11("Drug2").ToString()) stringxml10.AppendFormat("<set value='{0}'/>", rst11("drugcount").ToString()) End While rst11.Close() conn10.Close() stringxml10.Append("</dataset>") stringxml10.Append("<styles> <definition> <style name='B' type='animation' easing='bounce' duration='1' /> <style name='Bevel1' type='bevel' angle='0' /> <style name='Anim1' type='animation' param='_xScale' start='0' duration='3' /> <style name='Anim2' type='animation' param='_alpha' start='0' duration='3' easing='bounce' /> </definition> <application> <apply toObject='CANVAS' styles='Anim1, Anim2, Bevel1' /> ") stringxml10.Append("<apply toObject='DATAPLOT' styles='Anim1, Anim2, Bevel1, B' />") stringxml10.Append("</application> </styles>") stringxml10.Append("</graph>") conn10.Close() Literal4.Text = FusionCharts.RenderChart("FusionCharts/MSBar2D.swf", "", stringxml10.ToString(), "TheMonth9", "500", "300", _ False, True) End Using -
Does anyone have an example of a multi0series chart using a SQL query as a data source?
-
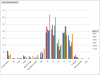
If I want to make a multi-series bar chart do I have to use a separate query for each data series (one series per month) or can I pull the data one time? I want to count rows for multiple departments for a 12 month period and group them by month. So, unit1 (Jan=25, Feb=30, Mar=35, Apr=32, etc..) unit2 (Jan=120, Feb=87, Mar=34, etc...)......
It will look something like the attachment.
-
Got it. thanks for the help!
-
Thank you for the response. I understand what I need to do, I guess I do not understand how. I can manually create the XML with no problem, but I cannot seem to generate via code.
-
-
Still having issues. The XML is attached. Here is my code:
Dim connectionString10 As String
Dim ds10 As New DataSet
Dim stringxml10 As New StringBuilderconnectionString10 = "Data Source=pharmweb;Initial Catalog=rx_emp;User ID=PicUser;Password=AKa1970LJ"
stringxml10.Append("<graph caption='Turn Time Average by Hour' showvalue='0' PYAxisName='Hour' SxAxisName='Total Orders' >")
Using conn10 As New SqlConnection(connectionString10)conn10.Open()
Dim qry10 As New SqlCommand("select count(order_id) as NumOrders, avg(datediff(MI,orig_dt_tm, rev_dt_tm)) as AvgTurnTime, datepart(hh,rev_dt_tm) as 'Hour' from cerner_order_info where datediff(MI,orig_dt_tm, rev_dt_tm) < 25 group by datepart(hh,rev_dt_tm) order by datepart(hh,rev_dt_tm)", conn10)
Dim rst10 As SqlDataReader = qry10.ExecuteReader()
While rst10.Read()'stringxml10.Append("<set label='" & rst10("Hour").ToString() & "' value='" & rst10("AvgTurnTime").ToString() & "' />")
stringxml10.Append("<categories> ")
stringxml10.Append("<category label='" & rst10("Hour").ToString() & "' />")
stringxml10.Append("</categories>")
stringxml10.Append("<dataset seriesName='AvgTurnTime' >")
stringxml10.Append("<set value='" & rst10("AvgTurnTime").ToString() & "' /> </dataset>")
stringxml10.Append("<dataset seriesName='# of Orders' renderAs='Line' >")
stringxml10.Append("<set value='" & rst10("NumOrders").ToString() & "' /> </dataset>")
End While
stringxml10.Append("</graph>")rst10.Close()
conn10.Close()
Literal6.Text = FusionCharts.RenderChart("FusionCharts/MSColumn3DLineDY.swf", "", stringxml10.ToString(), "AvgTurnTime", "500", "400", _
False, True)
End Using -
The chart renders but not correctly. Basicaaly all data is plotted under the first label. What am I missing?
Dim connectionString10 As String
Dim ds10 As New DataSet
Dim stringxml10 As New StringBuilderconnectionString10 = "Data Source=pharmweb;Initial Catalog=rx_emp;User ID=User;Password=password"
stringxml10.Append("<graph caption='Turn Time Average by Hour' showvalue='0' yAxisName='Hour' xAxisName='TurnTime' >")
Using conn10 As New SqlConnection(connectionString10)conn10.Open()
Dim qry10 As New SqlCommand("select count(order_id) as NumOrders, avg(datediff(MI,orig_dt_tm, rev_dt_tm)) as AvgTurnTime, datepart(hh,rev_dt_tm) as 'Hour' from cerner_order_info where datediff(MI,orig_dt_tm, rev_dt_tm) < 25 group by datepart(hh,rev_dt_tm) order by datepart(hh,rev_dt_tm)", conn10)
Dim rst10 As SqlDataReader = qry10.ExecuteReader()
While rst10.Read()
stringxml10.Append("<categories> ")
stringxml10.Append("<category label='" & rst10("Hour").ToString() & "' />")
stringxml10.Append("</categories>")
stringxml10.Append("<dataset seriesName='AvgTurnTime' renderas='Area'>")
stringxml10.Append("<set value='" & rst10("AvgTurnTime").ToString() & "' /> </dataset>")
stringxml10.Append("<dataset seriesName='# of Orders' renderas='Line' parentYAxis='S'>")
stringxml10.Append("<set value='" & rst10("NumOrders").ToString() & "' /> </dataset>")
End While
stringxml10.Append("</graph>")rst10.Close()
conn10.Close()
Literal6.Text = FusionCharts.RenderChart("FusionCharts/MSColumn3DLineDY.swf", "", stringxml10.ToString(), "AvgTurnTime", "500", "400", _
False, True)
End UsingEnd Sub
-
What I am trying to eventually get to is a combination chart (column/line). With static data, the XML would look somehting like this:
<chart caption='Pharmacy Verify Times' xAxisName='Time' yAxisName='TurnTime' numberPrefix=''
bgImageAlpha='30' bgImage='gb1.jpg'>
<categories>
<set label='09:30' value='1' />
<category label='09:45' />
<category label='10:00' />
<category label='10:15' />
<category label='10:30' />
<category label='10:45' />
<category label='11:00' />
<category label='11:15' />
<category label='11:30' />
<category label='11:45' />
<category label='12:00' />
<category label='12:15' />
<category label='12:30' />
</categories>
<dataset seriesName='TurnTime' >
<set value='10' />
<set value='7' />
<set value='8' />
<set value='8' />
<set value='15' />
<set value='6' />
<set value='15' />
<set value='8' />
<set value='11' />
<set value='19' />
<set value='6' />
<set value='7' />
</dataset>
<dataset seriesName='TotalOrders' renderAs='Line'>
<set value='3' />
<set value='7' />
<set value='13' />
<set value='6' />
<set value='3' />
<set value='28' />
<set value='26' />
<set value='13' />
<set value='8' />
<set value='15' />
<set value='7' />
<set value='12' />
</dataset>
<dataset seriesName='Caution'renderAs='Line'>
<set value='10' />
<set value='10' />
<set value='10' />
<set value='10' />
<set value='10' />
<set value='10' />
<set value='10' />
<set value='10' />
<set value='10' />
<set value='10' />
<set value='10' />
<set value='10' />
</dataset>
<dataset seriesName='HelpLine'renderAs='Line'>
<set value='15' />
<set value='15' />
<set value='15' />
<set value='15' />
<set value='15' />
<set value='15' />
<set value='15' />
<set value='15' />
<set value='15' />
<set value='15' />
<set value='15' />
<set value='15' />
</dataset>
<styles>
<definition>
<style name='CanvasAnim' type='animation' param='_yscale' start='1' duration='1'
easing='regular' />
<style name='CanvasAnimX' type='animation' param='_xscale' start='0' duration='2'
easing='stretch' />
<style name='MyFirstGlow' type='Glow' color='FF5904' alpha='55' blurX='53' blurY='13' quality='10' strength='3'/>
</definition>
<application>
<apply toObject='Canvas' styles='CanvasAnim,CanvasAnimX,MyFirstGlow' />
</application>
</styles>
</chart>
Hi Jerry,
Can you please elaborate a bit more on your point? What chart are you trying to render?
-
I finally got it to work. I have an additional question now. I have a query that returns 6 columns of data. Something like ('11:00','22','10','15','2','3'). How do I set that up in the XML?
thanks for the help!
-
This is very frustrating. Here is my code. The chart does not show. No error messages.
Dim connectionString As String
Dim ds As New DataSet
Dim stringxml As New StringBuilder
connectionString = "Data Source=pharmweb;Initial Catalog=rx_emp;User ID=user;Password=password"
stringxml.Append("<chart caption='Unit Census' pallette='3' showvalues='0' useroundedges='1'>")
Using conn As New SqlConnection(connectionString)
conn.Open()
Dim qry As New SqlCommand("select a.census as Census, b.loc_desc as Unit from census_unit a,cerner_location b where(a.unit = b.loc_id) and a.mydate = (select max(c.mydate) from census_unit c) order by b.loc_desc asc", conn)
Dim rst As SqlDataReader = qry.ExecuteReader()
While rst.Read()
stringxml.AppendFormat("<set label='{0}' value='{1}'/>", rst("Unit").ToString(), rst("Census").ToString())
End While
stringxml.Append("</chart>")
rst.Close()
conn.Close()
Literal1.Text = FusionCharts.RenderChart("FusionCharts/FCF_Bar2D.swf", "", stringxml.ToString(), "Census", "600", "300", False, True)
End Using
Hi Jerry,
Welcome to FusionCharts Forum!

Following link can be useful for you:
http://blog.fusionch...arts-xt-part-2/
If this doesn't suffice your requirement. please feel free to revert.
-
How do I use a SQL Server 2000 query to format my XML file for use with Fusion Charts? I have tried "select for xml" but cannot get it to work. Does someone have a working example or can anyone tell me how to do it?
Thanks
-
Ok, I have it working for static data. Now I want to generate the XML file with a button click. I am having trouble formatting the XML correctly so the chart will display. Here is what I have so far:
Dim connetionString As String
       Dim connection As SqlConnection
       Dim adapter As SqlDataAdapter
       Dim ds As New DataSet
       Dim sql As String
       Dim stringxml As String

       connetionString = "Data Source=pharmweb;Initial Catalog=rx_emp;User ID=user;Password=password"
       connection = New SqlConnection(connetionString)
       sql = "select a.census as Census, b.loc_desc as Unit from census_unit a,cerner_location b where(a.unit = b.loc_id) and a.mydate = (select max(c.mydate) from census_unit c) order by b.loc_desc asc for xml raw"
       Try
           connection.Open()
           adapter = New SqlDataAdapter(sql, connection)
           adapter.Fill(ds)
           connection.Close()
           stringxml = ds.Tables(0).Rows(0).Item(0)
           Using writer As StreamWriter = New StreamWriter("c:\LearningFusionCharts\MyFirstChart\reason.xml")
               writer.Write(stringxml)
           End Using
end try
Here is XML that works:
<chart caption='Unit Census' xAxisName='Unit' yAxisName='Census' numberPrefix=''>
 <set label='T7 Rehab' value='8' />
 <set label='T6' value='22' />
 <set label='T5' value='4' />
 <set label='T4' value='10' />
 <set label='T3' value='22' />
 <set label='T2' value='17' />
 <set label='Peds' value='4' />
 <set label='NSY' value='11' />
 <set label='MH' value='17' />
 <set label='ICUB' value='6' />
 <set label='ICUA' value='5' />
 <set label='ICNY' value='3' />
 <set label='Birthing Center' value='13' />
-
I have changed the path a couple of times now. Instead of just getting nothing, I get an image that says "no data to display"
thanks
Hi,
Could you please confirm the SWF name is exactly the same as mentioned in the Download Package else it would not be able to identify the SWF file and show this error message?
Please try using "FCF_Pie2D.swf" and see if this resolves the issue.
Ex: Literal1.Text = FusionCharts.RenderChart("~/FusionCharts/FCF_Pie2D.swf", "", xmlData.ToString(), "Census", "600", "300", False, False)
Hope this helps.

-
I have verified that all of these are correct. Any other thoughts??
Hi Jerry,
Can you please check with the below mentioned points and try again?
> Check if the SWF path is properly provided in your HTML page is correct. Also, check if the SWF file actually exists there.
> If you're working on a case-sensitive file system Operating System, check for the case of path and SWF file.
> Check if you've Adobe Flash Player 6 (or above) installed on your machine.
> Check whether you've enabled your browser to show ActiveX controls. Normally, all browsers are Flash-enabled.
-
Thanks for the input. I changed the <graph> tags to <chart> and the result is the same. The page loads but I do not see a graph. No error messages.
I did also change the path.
thanks
Hi Jerry,
Welcome to FusionCharts Forum!
What issue are you facing exactly? What error message did you while generating the charts? Have you able to generate the chart XML in proper format
Also, use <graph> tags instead of <chart> tags. And check for the database connectivity.
-
I am trying to evaluate Fusion Charts Free. I am just trying to get something to display using my own data and some of the code supplied in the download. Can anyone help me troubleshoot?
thanks
.Net code
Public Sub GetFactorySummaryChartHtml()
Dim conn As New SqlConnection("ConfigurationManager.ConnectionStrings(RX_EMPConnectionString).ConnectionString;")
conn.Open()
'xmlData will be used to store the entire XML document generated
Dim xmlData As New StringBuilder()
'Generate the chart element
xmlData.AppendFormat("<chart caption='Census' subCaption='' enableSmartLabels='1' pieRadius='140' pieSliceDepth='30' showBorder='1' formatNumberScale='0' numberSuffix=' Units' bgColor='ffcccc' >")
Dim cmd As New SqlCommand("select a.census as Census, b.loc_desc as Unit from census_unit a,cerner_location(
 where(a.unit = b.loc_id) and a.mydate = (select max(c.mydate) from census_unit c) order by b.loc_desc asc", conn)
Dim myReader As SqlDataReader = cmd.ExecuteReader()
While myReader.Read()
xmlData.AppendFormat("<set label='{0}' value='{1}' />", myReader("Census").ToString(), myReader("Unit").ToString())
End While
myReader.Close()
xmlData.Append("</chart>")
'Create the chart - Pie 3D Chart with data from xmlData
Literal1.Text = FusionCharts.RenderChart("~/FusionCharts/FCF_pie2d.swf", "", xmlData.ToString(), "Census", "600", "300", False, False)
conn.Close()
End Sub
ASP.net Code
<%@ Page Language="VB" AutoEventWireup="false" CodeFile="test2.aspx.vb" Inherits="test2" %>
<!DOCTYPE html PUBLIC "-//W3C//DTD XHTML 1.0 Transitional//EN" "http://www.w3.org/TR/xhtml1/DTD/xhtml1-transitional.dtd">
<html xmlns="http://www.w3.org/1999/xhtml">
<head id="Head1" runat="server">
<title>TestPage</title>
<script type="text/javascript" src="~/FusionCharts/FusionCharts.js"></script>
</head>
<body background="Logo_watermark.gif">
<form id="form1" runat="server">
<asp:Literal ID="Literal1" runat="server"></asp:Literal>
<br />
<span>
</span>
</form>
</body>
</html>

No Data Displaying
in FusionCharts Free and ASP.NET
Posted · Report reply
Thanks for the reply. I have questions regarding upgrading. How does it effect my existing charts? Can I upgrade and keep those charts as they are or do I need to rebuild all of them?
thanks