
BradG
-
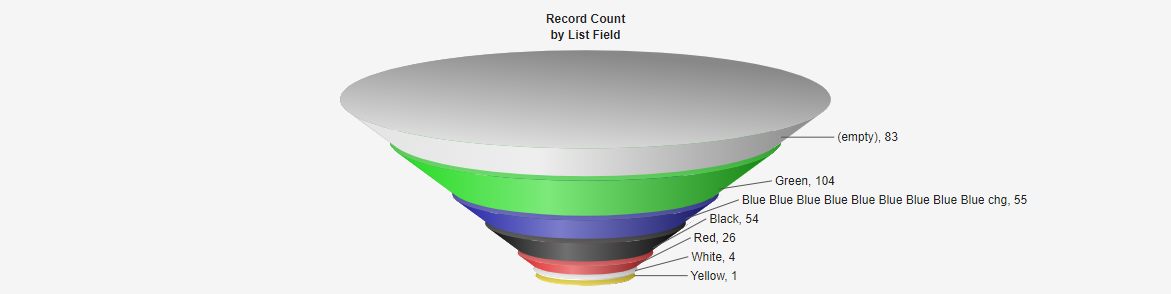
Content count
23 -
Joined
-
Last visited
Posts posted by BradG
-
-
We are using the dataplotclick event on gantt charts, but also using "link: 'j-$.noop'" so that the pointer cursor appears when hovering over each task. I found that it works in the latest version without an error if I add a "-" after "noop". The extra "-" was not necessary in 3.12.2.
-
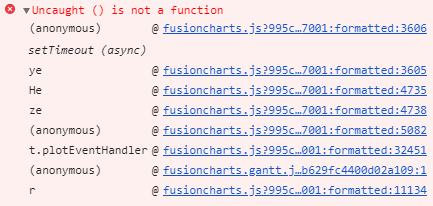
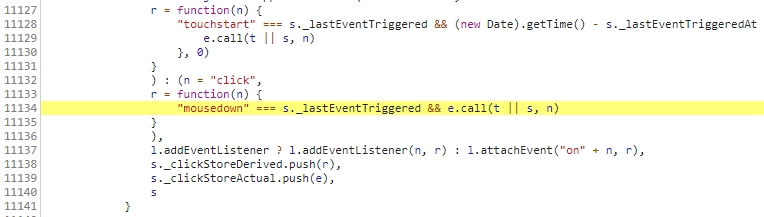
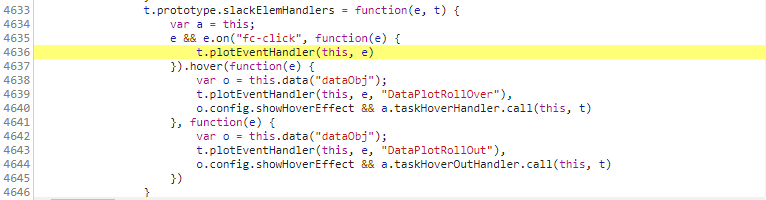
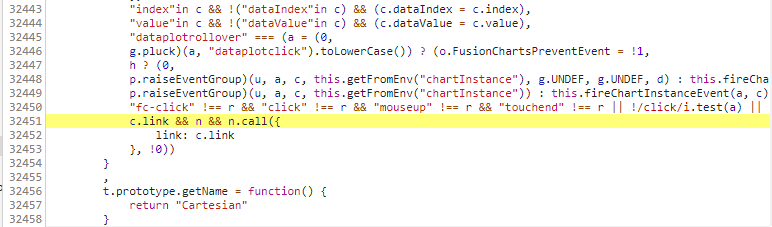
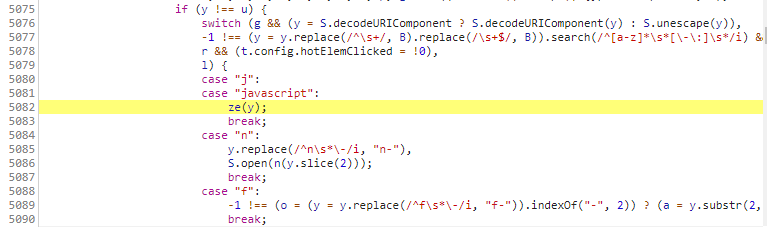
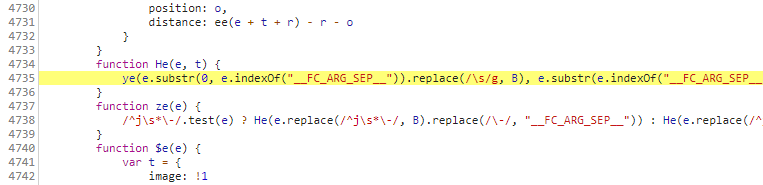
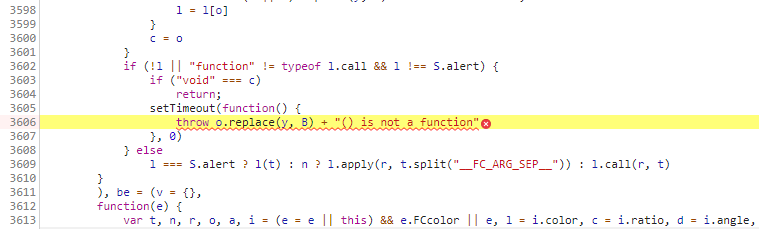
We're getting a javascript error when clicking on a bar in the gantt chart: "Uncaught () is not a function". I've attached screenshots of the call stack and relevant source code using minified files that have been "pretty-printed". This error does not occur when using 3.12.2.
-
We use Checkmarx Static Code Analysis to identify code vulnerabilities. In fusioncharts.js 3.12.2, Checkmarx reports 3 potential XSS issues when setting innerHTML to a text property:
line 310 (first occurrence):
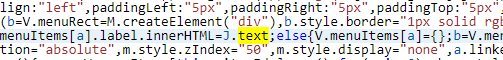
line 310 (second occurrence):

line 316:

Can you either fix these vulnerabilities or assure us that they cannot be used to enable a cross site scripting attack?
-
Thanks for the suggestion, but we need the default behavior, as described here: https://www.fusioncharts.com/dev/gauge-and-widgets-guide/gantt-chart/adding-scroll-to-chart.html
"Vertical scrolling is enabled by default depending on the height of the chart. If the number of processes fit within the height of the chart, vertical scrolling will not appear."
This rendering issue did not exist in 3.8.0. It only appeared once we attempted to upgrade to 3.12.2. Please provide a fix.
-
On touch-enabled Windows 10 laptops, the Gantt scrollbars render with a 4px border (stroke-width) when the scrollbar is narrow. For example, if you go to http://jsfiddle.net/fusioncharts/2g6pffz5/ and remove the "theme" setting from the config, the vertical scrollbar shows the issue on such machines:
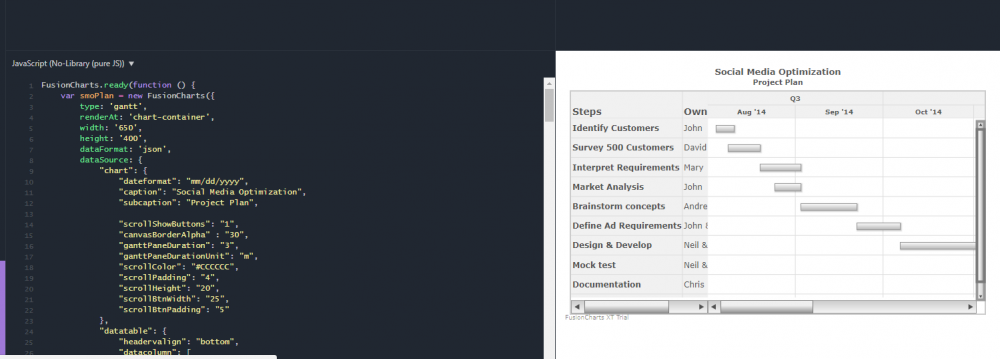
If you change the scrollHeight in the config to 11, the horizontal scrollbars will appear the same way. The behavior occurs on both Chrome and FireFox. In FireFox, if we apply the workaround mentioned in this topic: https://forum.fusioncharts.com/topic/19939-firefox-mousetouch-issues, the scrollbars render correctly (the same way they render on non-touch enabled machines). Our preference would be to have the scrollbars render the same on both touch and non-touch machines. However, if that is not possible, could you have the vertical scrollbar use the scrollHeight setting or provide something like a verticalScrollWidth setting that would render correctly using a value of 20 (for example)?
-
Referring back to the discussion of "non-functional horizontal scrollbar remains visible", this does seem like a bug according to your documentation here:
At the bottom of that section it says:
"If the duration specified by you is more than the actual time span of the chart, the scroll bar for the Gantt pane is not displayed."
Version 3.12.2 is not working that way (the scrollbar appears even when not needed).
-
Using 3.8.0, the funnel chart is centered:

but using 3.12.2, it is left-aligned:
which looks odd, especially since the caption is not centered over the chart and labels. We need it to be centered, or at least have an option to center it.
-
Charts on touch-enabled Windows 10 laptops using Firefox 55.0.3 and 56.0 (at least) are not working properly in terms of mouse interaction. On a problem machine, for example, using this pie chart link: http://jsfiddle.net/fusioncharts/9cPeU/ :
- Tooltips do not appear
- You cannot grab the pie chart and spin it
- Clicking a slice of the pie does not perform the normal animation
- The hover effect (changing the color) DOES work
Also, for this funnel chart link: http://jsfiddle.net/fusioncharts/8sJdx/ :
- Tooltips do not appear
- Clicking a segment of the funnel DOES perform the normal animation
Within our website, click interaction using the link property does not work for either of these chart types using this configuration.
For other chart types, tooltips do not appear on a problem machine, but click interaction (e.g., using the link property) does work.
All of the above work when using touch interaction with Firefox, but disabling touch does not fix the issue.
All of the above work on a problem machine when using Chrome.
-
If you change forceRowHeight to "1" in your fiddle, you will see the bug I described. Also, as mentioned in my update post above, the problem still also exists with forceRowHeight = "0" if you have enough processes.
-
Update: After further testing, we found that the problem still occurs when forceRowHeight is false when the number of processes increases (and the processes have Height set). It appears that the height of the DataTable cells are all set to the Height of the last Process.
-
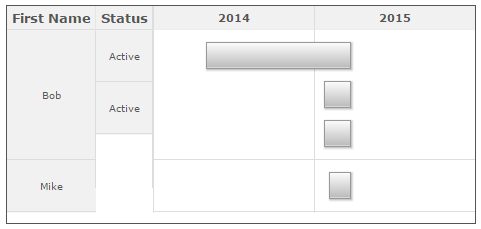
When using forceRowHeight (in both 3.6.0 and 3.7.0), the Gantt DataTable cells should use the corresponding Process height, but do not (and do not have a property to set their height). In the screenshot, the cells in the Status column should be the same height as the cells in the First Name column.
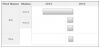 Below is the json used to generate the chart:{"chart": {"forceRowHeight": true},"categories": [{"category": [{ "start": "01/01/2014", "end": "12/31/2014", "label": "2014" },{ "start": "01/01/2015", "end": "12/31/2015", "label": "2015" }]}],"processes": {"headerText": "First Name", "process": [{ "id": "0", "label": "Bob", "height": 130 }, { "id": "1", "label": "Mike", "height": 52 }]},"dataTable": {"dataColumn": [{ "headerText": "Status", "text": [{ "label": "Active" }, { "label": "Active" }] }]},"tasks": {"task": [{ "start": "05/01/2014", "end": "03/24/2015", "processId": "0", "height": 26, "topPadding": 13 },{ "start": "01/23/2015", "end": "03/24/2015", "processId": "0", "height": 26, "topPadding": 52 },{ "start": "01/24/2015", "end": "03/24/2015", "processId": "0", "height": 26, "topPadding": 91 },{ "start": "02/04/2015", "end": "03/24/2015", "processId": "1", "height": 26, "topPadding": 13 }]}}
 -
I would like to request a stacked area + line combination chart.
-
In 3.4.0, the DragNode chart allowed you to drag a node without calling the link function when the mouse is released. In 3.5.0, it always calls the link function even when the node is dragged. Use this data to see the behavior:
{"dataset": [{"data": [{"x": "2","y": "5","name": "A","radius": "20","shape": "CIRCLE","link":"j-alert"},{"x": "3","y": "6","name": "B","radius": "20","shape": "CIRCLE","link":"j-alert"}]}],} -
With Fusion 3.5.0, the Funnel chart throws a javascript error when streamlinedData is set to 0: "Cannot read property 'fontSize' of undefined".
-
We use links in many chart types, but they are not working in Funnel and DragNode charts for this configuration:
Fusion 3.4.0, Microsoft Surface Pro 3, Chrome 38.0.2125.111m
Here is example json for a funnel chart:
{"chart":{"caption":"Count On Bug Id","subCaption":"by Status","chartTopMargin":0,"is2D":0,"isSliced":1,"streamlinedData":0,"showLabels":1,"showValues":1,"forceDecimals":0,"forceXAxisValueDecimals":0,"forceYAxisValueDecimals":0,"numberPrefix":"","numberSuffix":"","bgAlpha":0,"showBorder":0,"numberScaleValue":"1000000,1000","numberScaleUnit":"M,B","decimals":3,"animation":1,"defaultAnimation":1,"manageResize":1,"useEllipsesWhenOverflow":1,"captionFontSize":12,"subCaptionFontSize":12,"baseFont":"Arial, Helvetica, sans-serif","baseFontSize":12,"baseFontColor":"222222"},"data":[{"toolText":"Pending Dev Push, 1.3%","label":"Pending Dev Push","value":"1","link":"j-$.onx.chart.filter-94_04d4a651-76ce-497d-8b72-35487ea0da90"},{"toolText":"Awaiting Test, 2.7%","label":"Awaiting Test","value":"2","link":"j-$.onx.chart.filter-94_7434fa92-922b-4b3d-ba79-b5201f3f8746"},{"toolText":"Passed Test, 96%","label":"Passed Test","value":"72","link":"j-$.onx.chart.filter-94_e05ff384-91aa-4814-8b96-83e2a48c7476"}]}}
The slice animation does occur, but the javascript function referenced in the link does not run.
The exact same json works fine using the Surface with IE11 and using the same version of Chrome on non-Surface Windows 8.1.
-
We have downloaded our licensed files for 3.4, but there is no fusioncharts.jqueryplugin.js included in the download. Where do we get the latest version of the plugin and does it work with 3.4?
Brad
-
I'm trialing 3.3.1-sr3.21100 and still seeing this issue of the Edit dialog appearing in the html5 version when I click and hold down the mouse on a node (with viewMode=1). Any update on when this bug will be fixed?
Thanks,
Brad
-
Can you give me an update on when you expect to release the version that fixes this?
Thanks,
Brad
-
Is there any estimate of when this will be fixed?
Thanks,
Brad
-
Using 3.2.4-sr1.9888, the funnel chart is centered when using the Flash version, but left-aligned when using the HTML5/JavaScript version. I have verified that the JavaScript version is also left-aligned when using version 3.3.1-sr2.19840.
Flash:

HTML5:

-
3.2.4-sr1.9888
-
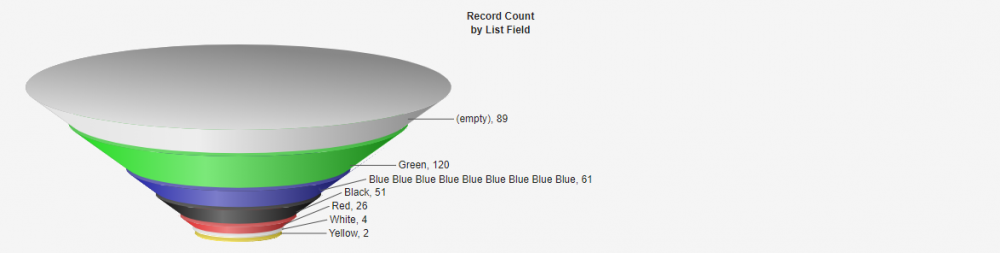
Line chart sometimes has gray rectangles obstructing parts of the chart:
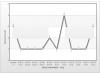
Occurs in Chrome 27.0.1453.94 m, using Flash 11.7.700.203 on Windows 8 when the containing div is 394px tall or less.
Does not occur in Chrome when the container is taller by 70 pixels.
Does not occur in Chrome using the HTML5 version.
Does not occur in FireFox 21.0, using Flash 11.7.700.224
Does not occur in IE10.0.9200.16540, using Flash 11.7.700.169
Here is the json data:
{"chart":{"xAxisName":"Date Submitted - Day","yAxisName":"Record Count","numberPrefix":"","numberSuffix":"","bgAlpha":0,"numberScaleValue":"1000000,1000","numberScaleUnit":"M,B","decimals":3},"data":[{"label":"(empty)","value":"3","link":"j-$.onx.chart.filter-183_1/1/0001 12:00:00 AM"},{"label":"4/2/2013","value":"1","link":"j-$.onx.chart.filter-183_4/2/2013 12:00:00 AM"},{"label":"4/22/2013","value":"1","link":"j-$.onx.chart.filter-183_4/22/2013 12:00:00 AM"},{"label":"4/24/2013","value":"1","link":"j-$.onx.chart.filter-183_4/24/2013 12:00:00 AM"},{"label":"4/26/2013","value":"1","link":"j-$.onx.chart.filter-183_4/26/2013 12:00:00 AM"},{"label":"4/30/2013","value":"2","link":"j-$.onx.chart.filter-183_4/30/2013 12:00:00 AM"},{"label":"5/1/2013","value":"1","link":"j-$.onx.chart.filter-183_5/1/2013 12:00:00 AM"},{"label":"5/2/2013","value":"4","link":"j-$.onx.chart.filter-183_5/2/2013 12:00:00 AM"},{"label":"5/3/2013","value":"1","link":"j-$.onx.chart.filter-183_5/3/2013 12:00:00 AM"},{"label":"5/7/2013","value":"1","link":"j-$.onx.chart.filter-183_5/7/2013 12:00:00 AM"},{"label":"5/9/2013","value":"1","link":"j-$.onx.chart.filter-183_5/9/2013 12:00:00 AM"},{"label":"6/6/2013","value":"3","link":"j-$.onx.chart.filter-183_6/6/2013 12:00:00 AM"}]}


Break at the top of a chart
in Suggestions & Requests
Posted · Report reply
Any plans to implement this in the near future? We have clients asking for it.