
sgiTed
-
Content count
8 -
Joined
-
Last visited
Posts posted by sgiTed
-
-
Specially, the exported JPEG file contains either overlap or both overlap and label truncation.
p.s.: I meant to write "Specifically" (not sure why I can no longer edit the post). I know it's a little thing, but it was bugging me.

-
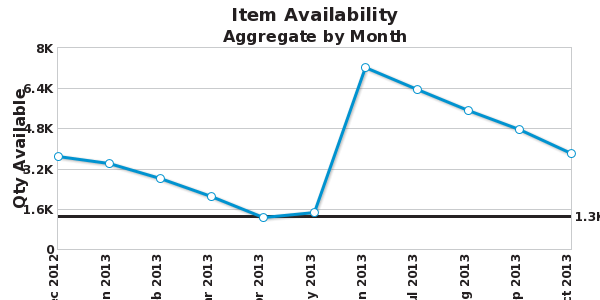
Hello. I'm experiencing an issue with the chart exporter of the Line and StackedColumn2D charts in pure javascript mode. Specially, the exported JPEG file contains either overlap or both overlap and label truncation.
Environment:
Firefox v23.0.1 on Windows 7
FusionCharts.version: 3,3,1,sr3,21100
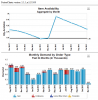
Screenshot of the charts rendered in the browser
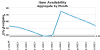
JPEG export of Line chart
(Note the overlap of the X-axis label and truncation of the Y-axis data point labels.)
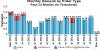
JPEG Export of StackedColumn2D
(Note the data set legend overlapping the Y-axis data point labels. There is also overlap within the data set legend.)
The PDF export suffers the same issues. Selecting "Download as PNG image" has no apparent effect. When I inspect the "Net" tab of Firebug I see that the POST to export.api3.fusioncharts.com resulted in "Failed to load the given URL".
I'd appreciate any insight and suggestions for this issue. Thanks!
HTML: TruncatedCrunchedChartExports.htm
Line Chart XML: itemAvail.xml
StackedColumn2D Chart XML: monthlyDemand.xml
-
Thanks Sumedh. I installed v3.3.1 sr3 and things are cooperating nicely. Thank you!
-
Thank you Swarnam! I'll keep an eye on this thread.
-
Hi,
Welcome to FusionCharts Forum!
We are able to replicate the same issue and we are looking into this issue.
We will get back to you on this,shortly.
Thanks for your time and support.
Hi Sumedh,
It's been a few weeks; has there been any progress on this particular issue?
Thanks!
-
-
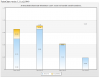
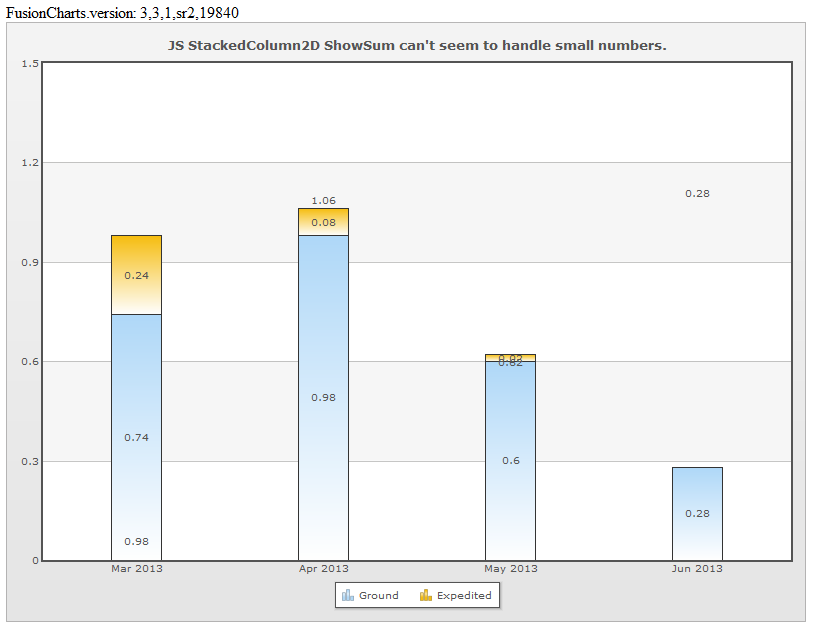
Hello all. I'm experiencing some weirdness when the values provided to the Javascript version of StackedColumn2D are less than one. Specifically, the sums do not always render at the top of the stacks / columns.
Environment:
Firefox v22.0 on Windows 7 (with reports of the same thing happening on Firefox v19 on Mac)
FusionCharts.version: 3,3,1,sr2,19840
Screenshot:
HTML:
<html>
  <head>
    <title>JS StackedColumn2D ShowSum can't seem to handle small numbers</title>
    <script type="text/javascript" src="FusionCharts/FusionCharts.js">
    </script>
  </head>
  <body>
    <div>
        FusionCharts.version:
        <script type="text/javascript">document.write(FusionCharts.version);</script>
    </div>

    <div id="chartDiv"/>

    <script type="text/javascript"><!--
      // FusionCharts.debugMode.enabled( function() { console.log(arguments); }, 'verbose');

      var myChart = new FusionCharts("StackedColumn2D", "theChartJS", "800", "600");
      myChart.setDataURL("chart.xml");
      myChart.render("chartDiv");
    // -->
    </script>
  </body>
</html>
chart.xml:
<chart showSum="1" caption="JS StackedColumn2D ShowSum can't seem to handle small numbers.">
  <categories>
      <category label="Mar 2013"/>
      <category label="Apr 2013"/>
      <category label="May 2013"/>
      <category label="Jun 2013"/>
  </categories>

  <dataset seriesName="Ground">
      <set value="0.74"/>
      <set value="0.98"/>
      <set value="0.60"/>
      <set value="0.28"/>
  </dataset>
  <dataset seriesName="Expedited">
      <set value="0.24"/>
      <set value="0.08"/>
      <set value="0.02"/>
      <set value=""/>
  </dataset>

<!--
  <dataset seriesName="Ground">
      <set value="74"/>
      <set value="98"/>
      <set value="60"/>
      <set value="28"/>
  </dataset>
  <dataset seriesName="Expedited">
      <set value="24"/>
      <set value="8"/>
      <set value="2"/>
      <set value=""/>
  </dataset>
-->
</chart>
Note that when I replaced the <dataset> elements with the commented-out ones then the sums render properly at the top of each respective stack, which is why I suspect that small numbers are instigating the issue. Very mysterious!
I'd appreciate any insight and suggestions for this issue. Thanks!


Export pure Javascript chart: truncation and overlap
in Bug Reports
Posted · Report reply
Thanks Haritha! I removed baseFont="Arial Narrow" on my end and the export feature looks much better.
PNG export is working now, too.