
tcraigen
-
Content count
43 -
Joined
-
Last visited
Posts posted by tcraigen
-
-
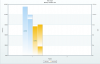
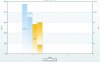
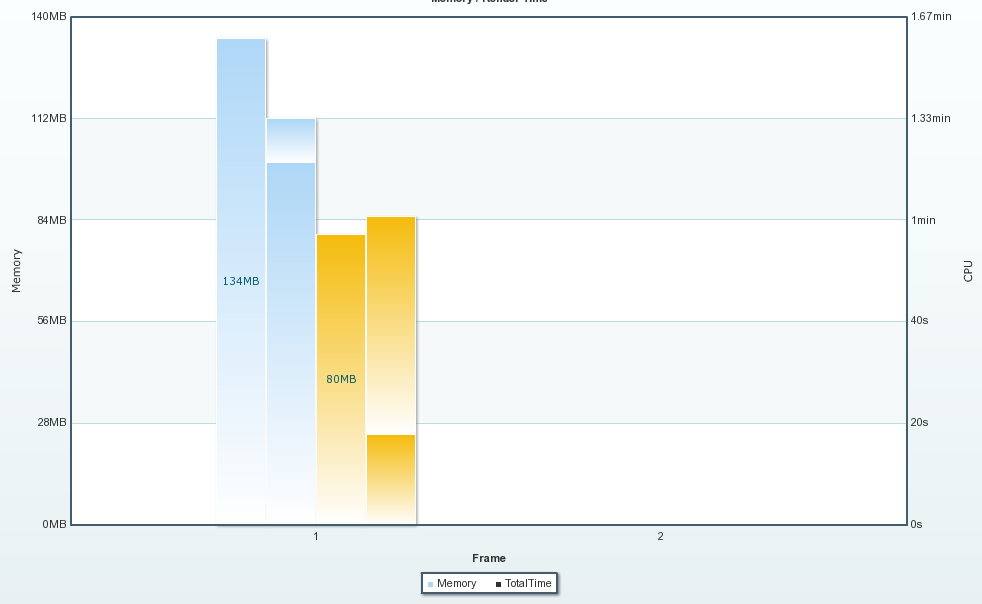
I am trying to use the stacked chart
MSStackedColumn2DLineDY in the example above.
I am not sure if this the chart I want to use.
What I need is the Dual Y Axis and the ability to do stacked data on the Dual Y chart.
The left stack will be "Memory" and the right two stacks will be two different breakdowns of CPU for a total of 3 columns (the image only shows two right now).
I will be adding things like average and standard deviation calculations to the graph as well as trend lines.
I have attached a sample graph of what is close to what I am looking for.
I am also working with Pallav, he responded to my bug report. Wanted to let you know so that you guys are not duplicating efforts.
I have a python object that determines the format based on the graph type passed. This I have created by following the details in the documentation format.
Thanks,
Tom
-
Reading the documentation, it looks like Fusion Charts reads all the data and then auto scales based on the data.
Is it possible the the SYAxis is not looking at the primaryYAxis='S' that I have used in the dataset?
It's been 2 weeks and I have yet to find a good work-around.
The Scaling seems to not work for the Secondary Axis ( for any of the Multi-Series Dual Y charts ).
Tom
-
I have discovered the problem, though it still does fix my problem.
Setting the
SYAxisMaxValue='10000'
Seems to get things in the normal scale. I am not so sure this is correct though, as changing the number to a higher number seems to change the numbers on the right of the scale.
This features (the Secondary Y Axis) seems to not be working as the documentation says it should.
I hope that this is a known bug, as it is holding up development for us.
Thank you,
Tom
-
You might want to check permissions on the graphs.
Also, what do you get when you set the graph to debug mode?
Tom
-
I am unable to get the Scaling to work with the Y Axis values.
No matter what values I use in the Secondary Axis, I always get the same number scale.
Also, when I use the default labels the graph uses MB/GB instead of Time scale.
I have attached the XML File,
-
If you are running on Linux, this is know problem. Flash will be on top any javascript / css driven objects.
This is a browser problem, not a fusion bug.
As for other browsers, you might be able to get it to work if you set the calender to have a z-index of something higher than the chart.
span style='z-index: 100; background-color: red' id='jschart'
style='z-index: 0' id='fusionchart'
-- those should be in span tags, but the IFCode never works for me.
-
With this same file, I am having problems with the Secondary Axis mouse over using the incorrect units.
Am I missing something? I set the parentYAxis='S'
-
That seemed to work, but would be inconsistent to how the web color's are used (via CSS / HTML).
Is this a know bug?
Tom
-
Not sure why this is not working for the second dataset. But it seems that the graph is changing the legend color to the incorrect color.
Here are the sample files.
I should note that I am on linux and using firefox.
Tom
-
I have done extensive work with AJAX and fusion charts.
The first tricky part, you need to double escape the string after the url base path.
function draw_chart(debug) {
      var chart = new FusionCharts("/charts/MSStackedColumn2DLineDY.swf", "DynamicChart", "1000", "650",debug, "1");

      query = "/cgi-bin/FusionChart.py?xml=/server/path/to/file/test.xml";

      chart.setDataURL( escape( query) );

      chart.render("fusion_chart");
}
You have to create span tag with "fusion_chart" as the id/name for the above code to work.
But this is what I have been using to generate the page.
Notice the "1" at the end of the new FusionCharts object.
This registers your chart object so you can update it via ajax.
function UpdateChart(type,path,query,w,h,debug) {
// this function will do an update using Ajax, the data is much more reliable
// trying to redraw the graph any other way spits back the XML incorrectly
try {
if(debug == undefined) {
debug=0;
}
var url = path;
var pars = query;
var myAjax = new Ajax.Request(
url,
{
method: 'get',
asynchronous: 1,
parameters: pars ,
onSuccess: function(request) {
//alert(url);
//alert(pars);
$('fusion_chart').setAttribute("class","");
var req = request.responseText.evalJSON();
var chart1 = new FusionCharts(type, "DynamicChart", w, h, debug, "1");
//alert(req);
chart1.setDataXML( escape(req) );
chart1.render("fusion_chart");
}});
} catch(e) {
alert("ERROR UpdateChart: " + e);
}
}
(Can't seem to get the Code tags to work, don't understand why this works on other sites and never really works here)
I think you may need to check the chart object to see if it exists before creating it again.
But my experience with the chart object is that its sometimes does not register. I abonded trying to reuse the object and just kept re-creating it everytime I needed a new update.
Another solution I came up with, does not really require ajax, is using an IFRAME with noborder, and update the the SRC to a path so that it draws the chart through a CGI script.
My py CGI script takes a path, resolves it internally and responds with XML output.
If you have lots of arguments, this can get tricky passing data around.
But it is important that the path for the XML generation is on the same server the AJAX call is running from.
Also, you can't do cross-domain AJAX calls, they all have to be local to the server running the webpage displaying the data.
Hope this helps,
-
Well, solved my own problem:
For python folks:
def printXML(file):

    fhand = open( file , 'r')

    print "".join(fhand.readlines())

    fhand.close()
Worked for me!!!
-
We are trying to link up files that live on mounted volumes.
The volumes are visible on the webserver. This is an internal server so we have no concern for security.
I am unable to get the graph to work if its pointing to the path on the volume.
I am, however, able to view XML the file no problem with the same command.
It looks like FusionCharts is using the WEB root path and not the file:/// path that I am giving it.
Do I need to format the string slightly different when passing a file:/// to the javascript function?
Here is what something like what I am trying to do.
function draw_chart(query,debug)

{

 var chart1 = new FusionCharts("/charts/MSLine.swf", "RTDynamicChart", "700", "600", debug, "0");

  query = "/data/FusionCharts/SampleFile.xml";

  //alert(query);

  chart1.setDataURL( escape( query) );

  //chart1.setDataURL( escape( "file://" + query) );

  if(debug) {

    document.write("View XML");

  }

    chart1.render("fusion_chart");

} -
I have been working with massive amounts of data. More data than I want to deal with.
Some data is more than 10,000 data points. I get the warning from flash and say yes to continue the script.
The data then loads (some times). It seems right around the 10K mark is where things get strange.
3K-7K seems to be ok most of the time.
Are there alternative solutions to displaying such data?
Also, do you guys have something that will print some basic stats in the graph?
Like min/max, maybe even STD+3/-3 +6/-6?
Sorry for the two part thread...
-
When I am in debug mode, I have yet to see the inconsistent result.
-
You can write out the HTML and build your header with the Javascript, then use the FusionCharts.js to send your script to your page.
But as far as an include, I dont think any exist.
But if they did, it maybe on cpan.
-Tom
-
1. Mouse over hot spots:
I use a tablet much of my day. For the Scatter charts, the icons are really small.
If a hotpot could be identified, say iconRadius='12' would be 12 pixels or something like that.
i know this might be difficult for overlapping or data points that are very close.
This hot spot would go outside the icon.
Also, to that note, can we modify the size and type of icon?
2. Zooming in / Out with click drag functionality:
Example:
http://bigcharts.marketwatch.com/interchart/interchart.asp?symb=ADBE&time=8
I think this would be a great improvement to the simple charts, but I also think it should be something we can enable/disable.
3. Adding interactive Trend Lines live would be also nice, but not needed.
-
I have two questions,
1. I have a dynamic chart. The data sometimes takes a long time to load (this is due to the amount of data). The first few times seem to work great. Every once and a while, the graph will render 1 out of 3 total graphs. All using the same exact call.
Anyone experienced this? I can't seem to pinpoint any reproducible results.
2. Is it possible to update the progress bar, even if its not 100% accurate. I only ask, because the loading never shows any movement, just a square box. I would rather see a spinning beach ball then a progress bar anyway.
-Tom
-
xyperxex (1/7/2008)//Now write it to output stream
print "&label=" . $dateTimeLabel . "&showLabel=" . $intShowLabel . "&value=" . $randomValue . "|" . $randomValue2 . '&link=P-detailsWin,width=1800,height=900,toolbar=no,scrollbars=yes, resizable=yes-sampleLink.html';
I think you are missing a space:
print "&label=" . $dateTimeLabel . "&showLabel=" . $intShowLabel . "&value=" . $randomValue . "|" . $randomValue2 . '&link=P-detailsWin,width=1800,height=900,toolbar=no,scrollbars=yes, resizable=yes -sampleLink.html';
Also, don't forget to escape special characters or turn to html, & = &, that one just burned me this past week.
-
I am very interested in getting links to work for the SSGrid, the example above does not seem to work for me.
I am not sure exactly what you describe.
Could you provide an example?
Thank you,
Tom
-
That did it.
Thank you,
Tom
-
XML Parsing Error: not well-formed

Line Number 16, Column 140:

-

set y='174.28' x='202.64' link="P-allElement,width=820,height=625,toolbar=no,scrollbars=no,resizable=no -sfinElementStats.py?prod=BOLT&seq=char&shot=dhla&draw=1" toolText='dhla_v0002 174.28 sec. 202.64 MB' showName='1' showLabel='1'/

------------------------------------------------------------------------------------------------------------------------------------------^
I get an xml error when I view the attached XML file.
How can I fix this?
-
Currently I have not been able to find something that allows for adding text to my charts.
I like the categories, but I don't see any examples for changing the Y-axis.
I would like a text label placed in an X,Y location.
Something like
label x='25' y='60' text='my custom label'
or
category label='my custom label' y='60' x='25' showLabel='1'
If something like this already exists, could some point me to an example in the docs?
Thank,
Tom
-
Perfect, that did what I wanted.
-
How are you enoding the string?
If you are doing this through javascript, I found I needed to double escape everything after the question mark '?'.


Primary and Secondary Y Axis problem
in Bug Reports
Posted · Report reply
This graph seems to be working now with my data structure.
I had a typo for parentYAxis.
But I am still wondering if this graph will give me the graph I need described in the above post??
Thank you for your help.
Tom