
Andrew S.
-
Content count
12 -
Joined
-
Last visited
Posts posted by Andrew S.
-
-
Hi,
I've got such problem with x-axis labels in Scatter chart.
They look broken.
I'm using FusionCharts version 3.3.1-sr1.19666
It looks like regression. I didn't see that issue in previous versions.
Data source in attachment.
Thanks,
Andrew
-
Hi,
I downloaded the latest version:
@version fusioncharts/3.3.0-release.18739
It contains fix for the bug.
Thanks,
Andrew
-
Hi,
We have released a new version of FusionCharts XT i.e., FusionCharts XT v3.2.2 Service Release 4 on 6th August, 2012.
Being a service release version it has many bug fixes and enhancements.
Could you please try using this version? and let us know if you are still replicating.
Hi Sumedh,
I can confirm that the bug is not fixed.
I use FusionCharts version:
@version fusioncharts/3.2.3-sr1.5347
Thanks,
Andrew
-
Hi Madhumita,
I'm also interesting in such functionality. Looking through a discussion I'd like to clarify two moments:
1)
As of now, you can only add one custom menu label in FusionCharts.Did you mean that we can only customize "About..." menu item or add one custom field (in addition to "About...")?
2)
However, you can try and edit the source to achieve your requirements.Which source did you mentioned? Flex or JavaScript? To me modifying JavaScript is preferable as it doesn't required building binaries (swf)
and one more question
3) Is it possible to make "About.." link or any custom menu item action sensitive to mouse position?
I'd like to use several drill-down urls. One of the possibility to provide options in popup menu.
Thanks,
Andrew
-
Hi,
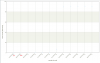
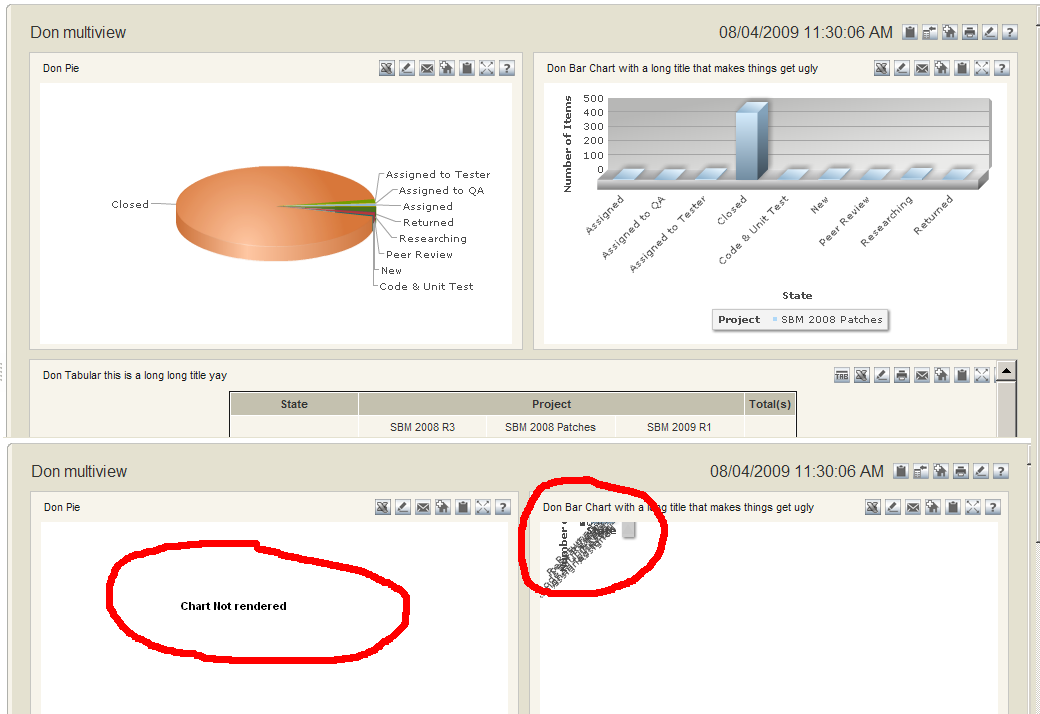
I noticed an issue in ExactFit scale mode.
If Y axis and/or X axis labels have spaces (e.g. "Number of Items"), they can be cut off in exactFit mode - look at attached screenshots.
Y axis label is cut off (exactFit mode):
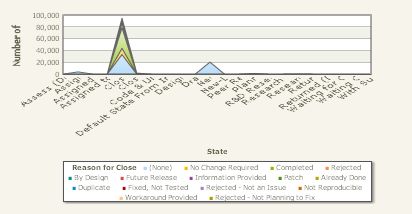
The same diagram in noScale mode:
Is there any workaround for this issue?
Thanks,
Andrew
-
Hello Supreme,
I hope this feature would be included in FC 4.0.
So when are you going to release new version?
Thanks,
Andrew
-
Hi,
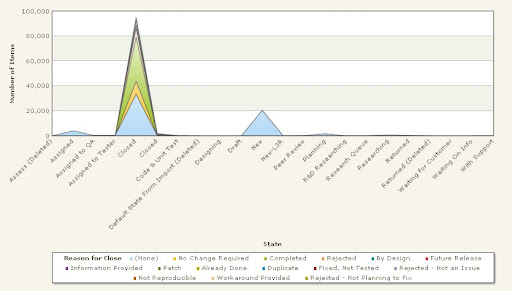
I tried to show some data in MSColumn3D chart and had a problem with legend size.
If I pass large quantity of series to xml and set rather small size of chart, the legend keeps too much space and chart is rendered badly. I set scaleMode parameter to "noScale".
One of the solutions is to use "exactFit" mode in such cases, but it becomes dependent on xml data, which is defined after initializing of FusionCharts object (scaleMode).
Preferable solution - to handle legend size in xml.
Is there a way to control legend size, like set minimal visible lines (2/3) in legend to make it scrollable?
Thanks,
Andrew
-
Hi,
I've faced with similar problem recently. Do you use IE or FF browser?
-
Hi,
We are seeing some rendering issue with Fusion Charts in IE, especially around resizing of the charts. We are using,
new FusionCharts( "FusionCharts/" + swfResource, "chartId", "100%", "100%", "0", "1", "exactFit");
Also attached is a screen shot that highlights the rendering issue we are having in IE.
FusionChart.js version 1.2.3
Thanks,
Andrew
-
Great!
Why it didn't work in my case?
Is the reason of the problem in old swf file version?
-Andrew
-
Hi,
I have a question about drill-down capability in Logarithmic charts.
I use 'link' attribute in 'set' tags to call JavaScript function with some parameter.
For example:
dataLinkClicked(url) - is JavaScript method which do some things and then set location to "url".
It works fine for ordinary Fusion Charts (column, line, etc.), but Power Charts (LogMSLine, LogMSColumn2D) don't process link correctly.
As I investigated chart redirected to url as it was specified (without calling JS method): "j-dataLinkClicked-url".
So my question:
Is this feature (call JS in links) supported in Logarithmic Charts or not? I've seen it's described in PowerCharts docs.
Thanks,
Andrew
P.S. Creation date of log swfs is Feb 16 2008. (PowerCharts v. 3.0)

Scatter Chart breaks slanted labels
in General usage
Posted · Report reply
Hi,
Thanks for quick response.
Yes. Proposed workaround works fine for me.
Are you planning to fix this issue in future releases?
Thanks,
Andrew