
Abid Sofi
-
Content count
17 -
Joined
-
Last visited
Posts posted by Abid Sofi
-
-
Hi,
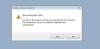
I am using fusion charts and php, it gives me error on Internet Explorer 8. While it works fine in Chrome and Mozilla browsers.
Here is the piece of code:
<CODE>
<div id="div-1a"><?phpecho renderChart('../../../FusionCharts/FusionCharts_EntPlus/Charts/Pie2D.swf', 'Data.php', '', 'chart1a', '100%', '100%', false, true);?></div><CODE>The error is as attached.
Could you please help?
Thanks.
-
Hi,
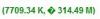
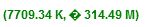
It shows the same code on the screen %A3 instead of £ sign.
Thanks.
-
Hi,
I am using below piece of code
<annotation type='text' x='95' y='190' fontSize='12' bold='1' label='(7709.34 K, £ 314.49 M)' color='008000' align='left' font='arial' wrap='1' wrapWidth='150' />
And it shows as in the screen shot, attached.
-
Hi,
I want to show the pound sign £ before any amount in fusion charts annotation text as label.
Can you please help.
Thanks.
-
Hi,
The below page is not getting displayed properly in IE 8,
http://www.fusioncharts.com/explore/world-map-with-countries/
Same issue when I am using FCMap_WorldwithCountries.swf in my Chart.
The page is hanging and map is not getting displayed, I have also attached the screenshot.
Can you please help.
Thanks.

-
Hi Abid,
Alert Manager works for Real Time charts and Gauges.
Can you please try for Real Time Bulb Gauge? Please find the attached screenshot for your reference.
Thanks Swarnam !
-
Hi,
I tried the following piece of code in FusionWidgets Bulb, it did'nt work. Can anyone please help
<alerts><alert minValue='1' maxValue='2' action='CALLJS' param="alert('Value between 1 and 2');" /></alerts>I referred this link, http://docs.fusioncharts.com/widgets/Contents/?AlertManager/Introduction.htmlThanks. -
Hi,
I tried the following piece of code in FusionWidgets Bulb, it did'nt work. Can anyone please help
<alerts><alert minValue='1' maxValue='2' action='CALLJS' param="alert('Value between 1 and 2');" /></alerts>Thanks. -
Hi,
How to play an audio in Fusion Charts.
Thanks
-
Hi ,
I want to develop application using fusion chart which can work on Blackberry os.
Can you help, how should I start.
Thanks.
-
Hi,
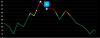
At point where green and yellow meet, it makes a doubt whether we are plotting it as green or yellow.
-
Have to create a word cloud or tag cloud.in fusion charts.
Do you have any suggestions.
-
Have uploaded what I really want?
-
I'm using MSLine.swf for single-series line chart.I need to display trendlines on the graph - or more specifically threshold ranges (like green <= 100 | yellow >120 and <140 | red >140).My question is:With line colors being automatically selected, is it possible to include those trendline (threshold) colors?Or how can we solve this problem in single-series line chart?Thanks for any advice.
-
I'm using MSLine.swf for single-series line chart.
I need to display trendlines on the graph - or more specifically threshold ranges (like green <= 100 | yellow >120 and <140 | red >140).
My question is:With line colors being automatically selected, is it possible to include those trendline (threshold) colors?Or how can we solve this problem in single-series line chart?
Thanks for any advice. -
I'm using MSLine.swf for single-series line chart.
I need to display trendlines on the graph - or more specifically threshold ranges (like green <= 100 | yellow >120 and <140 | red >140).
My question is:With line colors being automatically selected, is it possible to include those trendline (threshold) colors?Or how can we solve this problem in single-series line chart?
Thanks for any advice.


Error using fusion charts and php in Internet Explorer
in Suggestions & Requests
Posted · Report reply
Please ignore this post.