
gary.brain
-
Content count
18 -
Joined
-
Last visited
Posts posted by gary.brain
-
-
Hi, I was asked to have a look at Hightcharts for the HTML5 functions and as you are working with them to convert the fusion charts to html5 this was a great step forward.
One thing I was wondering if you are looking at is in Highcharts you can zoom in on any chart.
As this is already in HC are you planning on putting this into the conversion process.
thanks
G.
-
thanks for the spam

-
1 other thing to add is that is there any change to add a 2nd axis to this graph. I current use the "ScrollCombiDY2D" with the scroll bar and have cpu/memory in the 2nd axis 0 - 100 and data in the 1st.
The zoom is perfect but I loose the 2nd axis.
thanks
G.
-
Hi, 1st off thanks for the update, i have missed the ability to toggle the legend show feature and the zoom. So great work one and all.
2nd , had to make a small change to the FusionCharts-Gen.php and added the following to get the zoomline graph to work. Not sure if series type 2 is the correct place so just need confirmation.
$this->chartSWF['zoomline'][0]="ZoomLine";
$this->chartSWF['zoomline'][1]=2;
Any way thanks again guys.
G.
-
Hi Shamasis, thanks for the info.
I tried the update but I kept on getting error but will continue to play

Error: data is undefined
Source File: /js/jquery.fusioncharts.debug.js
Line: 1335
$('button').click(function(){$.get("/includeFile.php", {pageData: "xmlData"}, function(xmldata) {
$('#myChartContainer').updateFusionCharts({ data: xmldata.xmldata }) }, 'json');
});[/cpde]
FusionCharts: @version: 1.0.0b2 (build: 108)
Jquery : 1.4.1
-
i think its the xml data that is wrong, i change the code to json.
$.get("/includeFile.php", {pageData: "testdata" }, function(xmldata) { $('#myChartContainer').insertFusionCharts({ data: xmldata.xmldata }) }, 'json');
and the testdata file to
$update["xmldata"] = "
< graph caption='Pie Chart' decimalPrecision='0' showPercentageValues='0' showNames='1' numberPrefix='$' showValues='1' showPercentageInLabel='0' pieYScale='45' pieBorderAlpha='40' pieFillAlpha='70' pieSliceDepth='15' pieRadius='100' >
< set value='25' name='Item A' color='6666FF' / >
< set value='17' name='Item B' color='AD33FF' / >
< set value='23' name='Item C' color='19A3D1' / >
< set value='65' name='Item D' color='FFCC66' />
< /graph >
";
echo json_encode($update);
the only down side is that I have to set these all the time.
$.FusionCharts.config.extend(
{
product: 'v3',
className: 'myCharts',
type: 'Pie3D',
swfPath: '/MyFCPHPClassCharts/FusionCharts/',
dataFormat: 'XMLData',
width: '400',
height: '300'
});
-
Hi, I have finaly got around to playing with jquery plugin and was wondering if this is possible yet.
I want to update a graph data using a button (test purpose) knowing that the data has been altered.
< div id='quickgraph' >
< button >load data< /button >
< div id="myChartContainer" >Loading FusionCharts!< /div >
< script type="text/javascript" >
$("button").click(function () {
$.get("/includeFile.php", {pageData: "testdata" }, function(xmldata) { $('#myChartContainer').insertFusionCharts({ data: xmldata }) }, 'xml'); });
$.FusionCharts.config.extend(
{
product: 'v3',
swfPath: '/MyFCPHPClassCharts/FusionCharts/'
});
$('#myChartContainer').insertFusionCharts({
type: "Pie3D",
data: "",
dataFormat: "XMLData",
width: "400",
height: "300"
});
< /script >
< /div >
What I see is
The file is called as an XML file
GET 200 text/xml http://127.0.0.1/includeFile.php?_=1272048078565&pageData=testdata&fileid=70781495
the "testdata" file contains the xml data.
< graph caption="Pie Chart" decimalPrecision="0" showPercentageValues="0" showNames="1" numberPrefix="$" showValues="1" showPercentageInLabel="0" pieYScale="45" pieBorderAlpha="40" pieFillAlpha="70" pieSliceDepth="15" pieRadius="100" >
< set value="25" name="Item A" color="6666FF"/ >
< set value="17" name="Item B" color="AD33FF"/ >
< set value="23" name="Item C" color="19A3D1"/ >
< set value="65" name="Item D" color="FFCC66"/ >
< /graph >
The Default graph called
GET (Cache) application/x-shockwave-flash http://127.0.0.1/MyFCPHPClassCharts/FusionCharts/Column2D.swf
attempt to get a file that does not exist.
GET 404 text/html (NS_ERROR_FAILURE) http://127.0.0.1/Data.xml?FCTime=34
the restult is a failure.
I have also tried the append/prepend.
thanks
G.
-
Hi just a quick thanks for this great addition, I use jquery alot with fusion charts so know I have the best of both worlds.
-
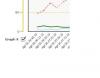
Hi Guys, here is the output from the debug and screen shot.
Hopefully its just me making a silly mistake
G.
-
Hi Basundhara , there is no error the graph works but it looks like it just ignores the paramaters.
File is : LogMSLine.swf
everything below works fine apart from the defaultnumberscale line.
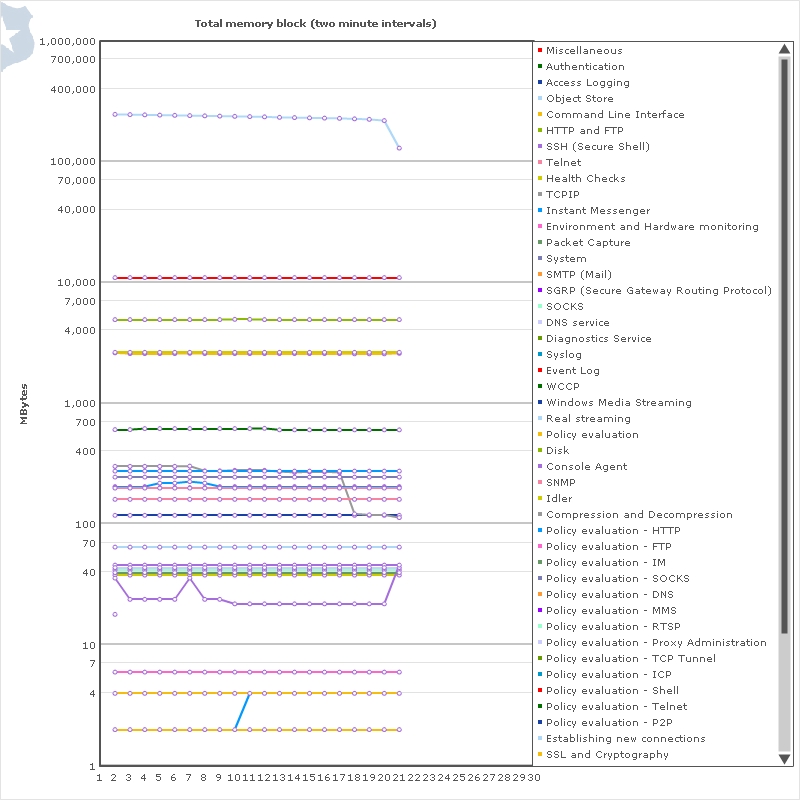
$strXML = "
	defaultNumberScale='bytes' numberScaleValue='1024,1024,1024,1024' numberScaleUnit='KB,MB,GB,TB'

	legendPosition='right'

	caption='".$headTitle."' showValues='0'

	showExportDataMenuItem='1'

	exportEnabled='1' exportHandler='/MyFCPHPClassCharts/PHP/FCExporter.php' exportAction='download'

	showMinorDivLineValues='1' yAxisValuesStep='3' numMinorDivLines='2'

	bgColor='#FFFFFF' showBorder='1' borderAlpha='20'

	logoURL='/images/half_logo.png'

	logoAlpha='20' logoScale='75'>";
thanks
Gary
-
Hi all, I use the following on basic graphs which works a treat.
chart defaultNumberScale='bits' numberScaleValue='8,1024,1024,1024,1024' numberScaleUnit='bytes,KB,MB,GB,TB'
But for some reason the Logarithmic is does not work.
Should it work or is it not a feature.
Thanks
G.
-
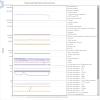
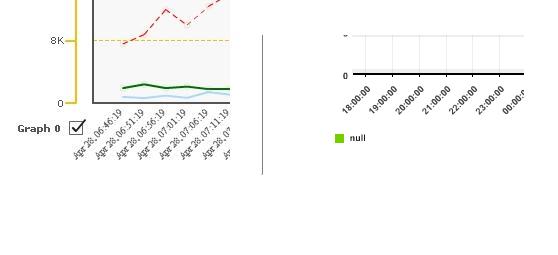
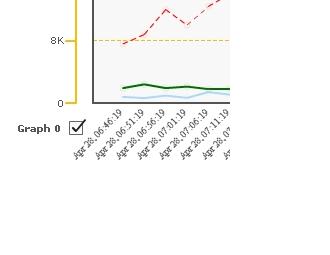
Hi, the issue for me is just the quality of the slant text.
I have attached a comparison of the differance of the images and the XML that makes up the graph.
best Regards
Gary
-
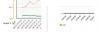
Hi, I am trying to use the slant axis but the font is coming out strange. I am migrating the graphs over from a free swf graph which shows the axis clearly.
I am using
style name='myDatalabels' type='font' font='Arial' size='10' color='000000'
but get the following
Thanks
G.
-
No problems, thanks for the quick reply.
G.
-
Hi, I have using the PHP Class to generate the basic graphs but cant seem to get the Power charts working.
e.g.
Works
$FC = new FusionCharts("MSLine","800","400");
dosnt Work
$FC = new FusionCharts("MultiAxisLine","800","400","true");
I am missing something or is this not possible.
thanks
G.
-
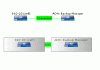
Hi, 1st of great product.... been adding the graphs and power graphs to my site to represent the data clearer.....
I have a small issue though.
Graph : DragNode
XML : being modified on export.
Javascript Function :
function updateXML()
{
var chartToPrint = getChartFromId("networkmap");
document.uploadxml.strXML.value=chartToPrint.getXML();
return true;
}
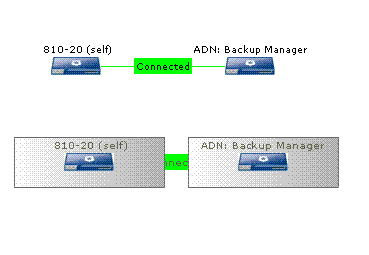
What I am doing is creating a network map based on the config from a device. This works well.
I have added a button on the page to get the XML from the chart and POST it to a page.
This then adds the XML output to a database record which is then read to rebuilt the graph. This way a user can add/delete to the diagram.
Now this all works.... the problem is the output is not including some of the code.
1) Set Change
Before : <set alpha='1' x='50' y='50' width='150' height='50' name='Proxy' color='FFFFFF' id='12344' imageNode='1' imageURL='/images/ProxySG.gif' imageAlign='MIDDLE' toolText='Proxy' />";
The exported line looks like this.
After : <set id='12344' x='50.5632183908046' y='50.7567567567568' name='12344' height='50' width='150' shape='RECTANGLE' imageNode='1' imageURL='/images/ProxySG.gif' imageHeight='-1' imageWidth='-1' imageAlign='MIDDLE' labelAlign='top' color='FFFFFF' />
What is missing is the alpha='1' which adds the background to the image.
1) Data Set
Before : <dataset plotBorderAlpha='0' allowDrag='1' showformbtn='0'>
After : <dataSet id='1' seriesName='' >
This results in the border around the image.
Also see graph Attached.
Is there a way to get around this (any additonal settings required) or code change by yourselfs.
Best Regards
Gary
-
Hi you can add the following to remove the border.
<dataset plotBorderAlpha='0' allowDrag='1' showformbtn='0'>
as for the height, this is used for the area around the image and not the image it self.
so I do
imageURL='/images/server.gif' imageAlign='MIDDLE'
then height = "height of the gif + xx px for the area above it for the text"
G.
Xformatnumberscale On Scatter.
in General usage
Posted · Report reply
Hi, in 3.2.2 it says that you can now use xFormatNumberScale or yFormatNumberScale for specific axis.
I have given this ago but it seems to work on the correct axis but the calculations are not being performed.
JSON Data.
{
"chart": {
"xFormatNumberScale":"1","xDefaultNumberScale":"bits","xNumberScaleValue":"8,1024,1024,1024,1024","xNumberScaleUnit":"bytes,KB,MB,GB,TB",
"bgColor":"FFFFFF",
"canvasBgColor":"FFFFFF",
"showBorder":"0",
"bgImage":"/images/background_logo3.png",
"bgImageScale":"50",
"yaxisname": "CPU %","yaxisminvalue": "0","yaxismaxvalue": "100",
"xaxisname": "http:client-bytes",
"showlegend": "1",
"shownames": "1",
"drawQuadrant": "1", "quadrantLabelTR":"High CPU / High Bytes",
"quadrantLabelTL":"High CPU / Low Bytes",
"quadrantYVal":"70",
"xaxismaxvalue": "4976000000",
"quadrantXVal": "4976000000",
"quadrantLineThickness": "1","quadrantLineColor":"3300ff"
},
"dataset": [
{
"id": "DS1",
"seriesname": "test1",
"plotborderthickness": "0",
"showplotborder": "1",
"color": "003300",
"data": [ { "x": "5909", "y": "60" },{ "x": "4383", "y": "62" },{ "x": "4308", "y": "63" } ]
},
{
"id": "DS2",
"seriesname": "test2",
"plotborderthickness": "0",
"showplotborder": "1",
"color": "0066cc",
"data": [ { "x": "175476", "y": "20" },{ "x": "117377", "y": "19" },{ "x": "119140", "y": "20" } ]
},
{
"id": "DS3",
"seriesname": "test",
"plotborderthickness": "0",
"showplotborder": "1",
"color": "0066cc",
"data": [ { "x": "19767633333", "y": "27" } ]
}
]
}
Script Code :
<div id="d_sizingGuide1" style="float: left;"></div>
<script>
FusionCharts.setCurrentRenderer('javascript');
var chart1 = new FusionCharts("/charts/Scatter.swf", "sizingGuide", "750", "250", "0", "1");
chart1.setJSONUrl("/chartData/chartData.php?pageData=sizingData");
chart1.render("d_sizingGuide1");
</script>
Working Display but both axis are converted.
"FormatNumberScale":"1","DefaultNumberScale":"bits","NumberScaleValue":"8,1024,1024,1024,1024","NumberScaleUnit":"bytes,KB,MB,GB,TB",
thanks
G.