
rohit111111
-
Content count
49 -
Joined
-
Last visited
Posts posted by rohit111111
-
-
Hello,
Previously I was not getting error while exporting to PNG,JPEG. Now, I am getting error. Please see the attached screen shot.
And the chart rendering mode is javascript.
Thanks,
Rohit
-
And also,
Sometimes we may need to show the numeric data as % on Y-axis. Is it possible?
Thanks,
Rohit
-
Hello,
Can we give specific color to any specific bar of column/bar chart and color for line in multi-series line chart?
Thanks,
Rohit
-
Tooltip not showing in flash mode but when i rendered chart as javascript, tooltip is appearing.
Kindly look into this.
Thanks,
Rohit
-
Its working in javascript mode only.
How we can display it in flash mode?
Please give me a demo if possible.
Thanks,
Rohit
-
Thanks.
-
And how we can show tool tip in spark chart?
Also, border color, thickness, point colors are not applying in spark chart.
Xml:
<chart caption="Spark Line" palette="2" borderColor="B6B5B5" openColor="0099FF" closeColor="0099FF" highColor="00CC33" lowColor="FF0000" borderThickness="8" setAdaptiveYMin="1" exportEnabled ="1" exportAtClient="1" exportHandler="fcBatchExporter"><dataset><set value="8.6"/><set value="9.1"/><set value="8.8"/><set value="8.83"/><set value="9.5"/></dataset></chart>
Kindly look into this.
Thanks,
Rohit
-
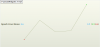
There are total five values. But only four are visible, if you see the screenshot.
Thanks,
-
Hello,
Spark line chart is also not loading correct.
Xml:
<chart caption="Spark Line Mean" palette="2" setAdaptiveYMin="1" exportEnabled ="1" exportAtClient="1" exportHandler="fcBatchExporter"><dataset><set value="8.6"/><set value="9.1"/><set value="8.8"/><set value="8.83"/><set value="9.5"/></dataset></chart>
One value is not showing. See attached screen shot.
Thanks,
-
Hello,
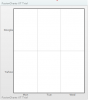
Heat Map chart is not loading correct.
Here is xml:
<chart><dataset><set rowId='Google' columnId='Mon' value='68'/> <set rowId='Google' columnId='Tue' value='35'/><set rowId='Google' columnId='Wed' value='95'/><set rowId='Yahoo' columnId='Mon' value='0'/> <set rowId='Yahoo' columnId='Tue' value='71'/></dataset></chart>
Attached is the screen shot. (Values and background color not coming)
If possible, give me a demo.
Thanks,
Rohit
-
Give an example, that will help.
-
What this 'numDivLines' attribute do?
-
And also in your example, the new x-axis goes to top. It has to be in bottom. So, what do you think?
Thanks,
Rohit
-
See the screenshot for reference.
-
Hello,
Can we increase the height of scatter points in scatter chart?
Thanks, Rohit
-
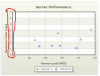
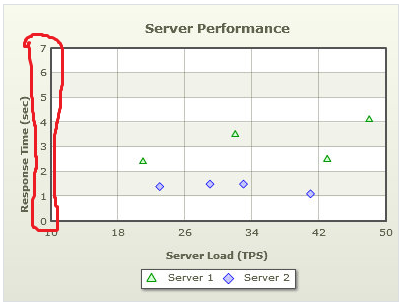
Hello,
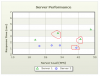
Can we set the scale on Y-axis?
You can see in image, y-axis scale is upto 7 and it sets automatically. Can we set this scale by own?
Thanks, Rohit
-
But by doing this, I think other things will also flip. For example: Chart Caption, It will also flip. That's what we don't want.
Thanks,
Rohit
-
I just take an example to explain you. I am asking about all of the fusion charts. Is it possible?
Thanks,
Rohit
-
Hello,
Is it possible to flip axis in fusion chart? Say X-axis comes in place of Y-axis and vice-versa.
Please see the screen shot for reference.
Thanks,
Rohit
-
Thanks for your reply.
1. Can we have a button on chart like back button which is shown if we drill to some level of chart?. As, now I am disposing parent chart and rendering new chart using javacript function. So, I need a button on which I will render parent chart again and dispose the child chart.
Is this possible to have button on chart?
2. In our application Charts Id and Charts are creating dynamically. So, when I am drilling a chart using js function and disposing parent chart and rendering new chart, I want the same div id in which parent chart is rendering. So can we do this? As in jquery, if we set 'this' (without quotes) as a parameter to function and bind this function to any element click attribute then we can get current element reference. You can check below:
For example:
<a onclick='GetId(this)'>Call</a>
function GetId(ref)
{
alert($(ref).text());
}
Can we do same like above function to get the reference of current element?
Thanks,
Rohit
-
Can you please let me know whether fusion chart api provides export functionality for drilldown charts if we goes upto nth level? so, that all charts upto we goes come into one file i.e. jpg or pdf.
-
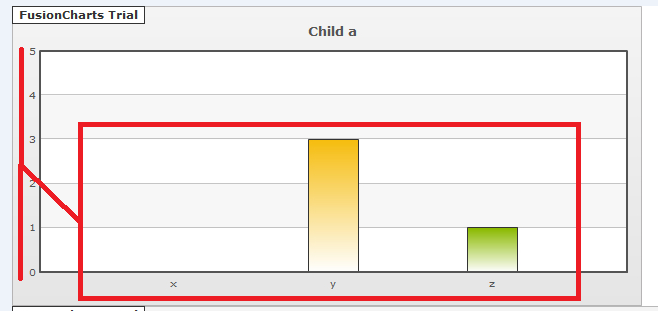
Sorry to say that but your demo sample for drill-down, which you have given above is not working. When I click on bar for 2004 year, it doesn't load anything and remains as usual. Please look into this.
Thanks,
Rohit
-
Thanks for your help.
But previously, I am trying with caption for gauge chart but its not working and now its working. And also i read in your past posts that caption is not available for gauge chart. To do this one has to use annotation text.
Anyway thanks.

Thanks,
Rohit
-
Hello,
1. I am trying to set annotaion text for Gauge Chart and its set correctly. But I am unable to set the position of annotation text to the center above the gauge like fusion charts XT which has option of "Caption". As, we are creating charts dynamically and we are not giving any height and width of chart. It automatically increase its width and height according to our defined template design in our application. So, without fixing the position of annotation text, how we can show the annotation text in center just above the gauge like the Fusion XT Charts?
2. Can we just show an annotaion image without having any chart?
Thanks,
Rohit


Widgets in Windows Form
in Using FusionWidgets XT
Posted · Report reply
Hello,
Can we show widgets in Window form application in asp.net?
Let me know whether javascript or flash or both are possible.
Thanks,
Rohit