
Bindhu
-
Content count
135 -
Joined
-
Last visited
Posts posted by Bindhu
-
-
Hi,
We do not support this as of now.
You will have to convert the data to XML format using your own logic.
Hope this clarifies.
-
Hi,
Thank you for the JSON data.
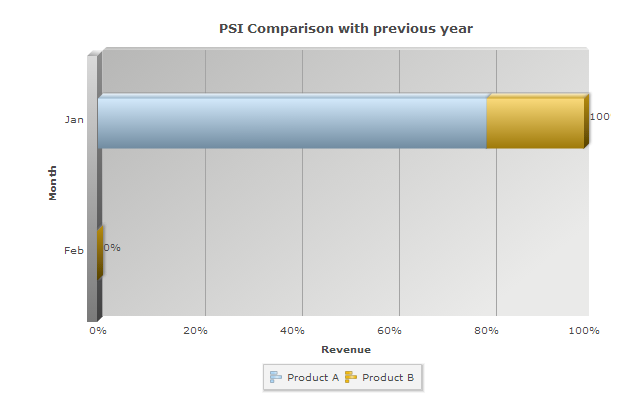
When you add up the values for 12-Jun-2013 series, it adds upto 100.01 and that is why yAxisMaxValue definition is overridden.
If the sum value is more than 100 even by 0.001, then the charting engine will override the yAxisMaxValue set and sets the max value to a little higher value to accommodate space for the higher value data plot.
Hope this clarifies. -
Hi,
You will not be able to add toolTips in the legend.
Hope this clarifies.
-
Hi,
We are unable to replicate the issue.
Please find attached screen shot.
Can you please share your complete JSON data for testing purposes?
Also, please let us know the chart dimensions being used.
-
-
Hi,
It should be released anytime soon now.
We will keep you posted when once the release is done.
Hope this helps!
-
Hi,
Welcome to FusionCharts Forum

Can you please confirm if you want those Pie charts to be interactive? If yes, then it is not supported.
If they are just images representing a pie chart, then yes, it is supported in our upcoming version, using annotations. You may click on the Scatter chart data plots(Pie chart) and then drill down.
Hope this clarifies!
-
Hi Raam,
Welcome to FusionCharts Forum
We do not support this feature, as of now.
Hope this clarifies.
-
Hi,
If the chart height is sufficient, then it will display all the y-axis values.
If there is no space to display all the y-axis values, then few values will be hidden, for good, ignoring the yAxisValuesStep attribute definition, to make the chart legible.
Hope this clarifies.
-
Hi,
We do not support any other pseudo-codes.
Hope this clarifies.
-
Hi,
It is working fine from our end.
Please find attached screen shot of the chart rendered.
Hope this helps!
-
Hi,
Scroll bar is supported only in Scroll Charts such as
 Scroll Column 2D Chart, Scroll Line 2D Chart, Scroll Area 2D Chart, Scroll Stacked Column 2D Chart, Scroll Combination 2D Chart and Scroll Combination 2D Chart (Dual Y) only.
Hope this helps!
-
Hi,
Welcome to FusionCharts Forum
Can you please share the XML data for testing purposes?
-
Hi,
It is not supported, as of now.
It is supported in the upcoming version(v3.4).
Hope this helps!
-
Hi,
The server is up and running.You may continue to export the charts.
If issue persists from your end, please try after clearing the DNS.
Hope this helps!
Thank you again for your continued support and patience. -
Hi,
The server is up and running.You may continue to export the charts.
If issue persists from your end, please try after clearing the DNS.
Hope this helps!
Thank you again for your continued support and patience. -
Sure Amol. I will keep you posted.
-
Hi,
We are looking into it and would update the below thread when the server is up and running.
Inconvenience caused is deeply regretted.
Thank you for your continued support and patience.
Please refer: http://forum.fusioncharts.com/topic/15925-fusion-chart-client-side-export-funcionality-stopped-working/
-
Hi Amol,
We are looking into it and would update this thread when the server is up and running.
Inconvenience caused is deeply regretted.
Thank you for your continued support and patience.
-
Hi,
Thank you for the details.
Can you please drop a mail to [email protected] stating the issue?
Also, please provide us your order id.
Hope this helps!
-
Hi,
Can you please let us know if you are using Flash Charts?
If yes, please let us know the version of FusionCharts suite XT that you are currently using.
-
-
-
Hi,
Welcome to FusionCharts Forum.
For pure JavaScript charts, export using PHP is one of the options, the other being use of Batik Rasterizer library.
You may use the Batik Rasterizer library. Batik Rasterizer library is a third-party library. Since Batik Rasterizer library is a third-party library, we do not have native implementation of this library in Java/J2EE. However, since Jar files of Batik have also been developed using Java, you can import the Jars files of Batik to use them directly in your Java based application.Hope this helps!
Vertical line marking cursor position?
in General usage
Posted · Report reply
Hi,
This is supported in our Zoom Line chart.
Please refer:http://www.fusioncharts.com/explore/zoom-scroll-charts/
For documentation, please refer: http://docs.fusioncharts.com/charts/contents/?ChartSS/ZoomLine.html
Hope this helps!