
knives
-
Content count
22 -
Joined
-
Last visited
Posts posted by knives
-
-
Hi Philippeb leave your email here i already created projects like yours maybe i can help you.............
-
Hi,
This must be strange to ask but is there anyway for the disable the drilldown functionality of linkedchart???????
for some reason i need to disable this feature. for in this example if i click the column i dont want the linkedchart to render
what attribute do i need to disable???????????? http://jsfiddle.net/fusioncharts/4cyFz/
-
Hi,
Anyone who need FusionChart DashBoard using Mysql/php Application feel free to hire me
-
i already did a way...........
-
tanx Moonmi this really helps.............
-
hi
using this code in documentation of
Multi-series Stacked Column 2D + Line Dual Y Axishow can i manually set the secondary values to display this values 14, 29, 43, 57, 71, 86, 100????????
FusionCharts.ready(function(){
var myChart = new FusionCharts({
"type": "msstackedcolumn2dlinedy",
"dataFormat": "jsonurl",
"dataSource":{"chart": {
"caption": "Quarterly Sales vs. Profit % in Last Year",
"subcaption": "Product-wise Break-up - Harry's SuperMart",
"xAxisName": "Quarter",
"pYAxisName": "Sales",
"sYAxisName": "Profit %",
"numberPrefix": "$",
"numbersuffix": "M",
"sNumberSuffix": "%",
"sYAxisMaxValue": "25",
"paletteColors": "#5598c3,#2785c3,#31cc77,#1aaf5d,#f45b00",
"baseFontColor": "#333333",
"baseFont": "Helvetica Neue,Arial",
"captionFontSize": "14",
"subcaptionFontSize": "14",
"subcaptionFontBold": "0",
"showBorder": "0",
"bgColor": "#ffffff",
"showShadow": "0",
"canvasBgColor": "#ffffff",
"canvasBorderAlpha": "0",
"divlineAlpha": "100",
"divlineColor": "#999999",
"divlineThickness": "1",
"divLineDashed": "1",
"divLineDashLen": "1",
"divLineGapLen": "1",
"usePlotGradientColor": "0",
"showplotborder": "0",
"valueFontColor": "#ffffff",
"placeValuesInside": "1",
"showXAxisLine": "1",
"xAxisLineThickness": "1",
"xAxisLineColor": "#999999",
"showAlternateHGridColor": "0",
"legendBgAlpha": "0",
"legendBorderAlpha": "0",
"legendShadow": "0",
"legendItemFontSize": "10",
"legendItemFontColor": "#666666"
},
"categories": [
{
"category": [
{
"label": "Q1"
},
{
"label": "Q2"
},
{
"label": "Q3"
},
{
"label": "Q4"
}
]
}
],
"dataset": [
{
"dataset": [
{
"seriesname": "Processed Food",
"data": [
{
"value": "30"
},
{
"value": "26"
},
{
"value": "33"
},
{
"value": "31"
}
]
},
{
"seriesname": "Un-Processed Food",
"data": [
{
"value": "21"
},
{
"value": "28"
},
{
"value": "39"
},
{
"value": "41"
}
]
}
]
},
{
"dataset": [
{
"seriesname": "Electronics",
"data": [
{
"value": "27"
},
{
"value": "25"
},
{
"value": "28"
},
{
"value": "26"
}
]
},
{
"seriesname": "Apparels",
"data": [
{
"value": "17"
},
{
"value": "15"
},
{
"value": "18"
},
{
"value": "16"
}
]
}
]
}
],
"lineset": [
{
"seriesname": "Profit %",
"showValues": "0",
"data": [
{
"value": "14"
},
{
"value": "16"
},
{
"value": "15"
},
{
"value": "17"
}
]
}
]
}});
}); -
hi
i am using Multi-series Stacked Column 2D + Line Dual Y Axis and i want to force my secondary y axis to show these values
14, 29, 43, 57, 71, 86, 100 how to i set my secondary y-axis to these values?????????????????
-
tanx Vishalika.........
-
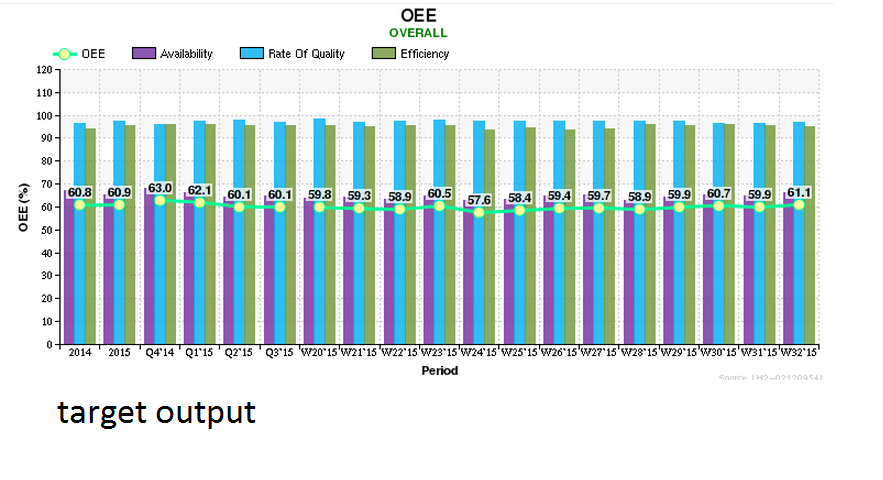
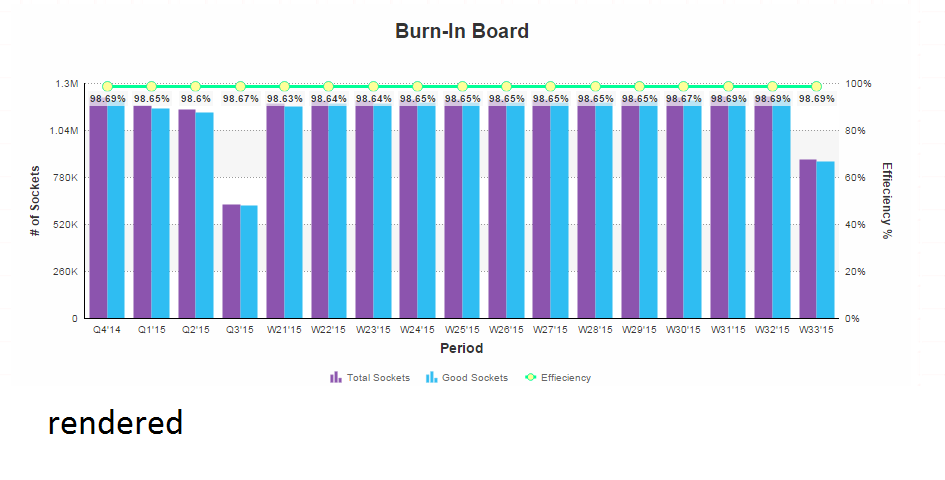
hi,
i have attached 2 images the TARGET CHART and the RENDER CHART.
some configuration in fusion charts are not working or i am doing it the wrong way please help me
i will give the detailed problems and i will also give the codes that i used to render my chart
1. show x-axis and y-axis tick marks - as shown in target chart
2. show vertical lines seperating the datas - as shown in target chart
3. make the x-axis and y-axis lines thicker
4. remove the % sign in line graph - as shown in target chart - as shown in target chart
5. i cannot predict the values of good sockets and total socket my chart primary y-axis has no allowance
it doesn't look good how can i give ample allowance to the primary y-axis - as shown in target chart
Thank You so much for the immediate response.......................
below is the codes i used for the RENDERED CHART
FusionCharts.ready(function(){var myChart = new FusionCharts({"type": "msstackedcolumn2dlinedy","renderAt": "kamote","width": 900,"height": 400,"dataFormat": "json","dataSource": {"chart": {"caption": "Burn-In Board","pYAxisName": "# of Sockets","pYAxisNameFontSize": "12","pYAxisNameFonBold": "1","sYAxisName": "Effieciency %","sYAxisNameFontSize": "12","sYAxisNameFonBold": "1","sYAxisMaxValue": "100","captionFont": "Arial","yAxisNameFont": "Arial","xAxisNameFont": "Arial","xAxisNameFontSize": "14","xAxisNameFontBold": "1","paletteColors": "#8C54AE, #2FBDF2","xAxisname": "Period","showAlternateHGridColor": "1","lineColor": "#00FF97","lineThickness": "3","anchorRadius": "5","anchorBgColor": "#FFFF99","captionPadding": "40","captionFontSize": "20","valueFontBold": "1","valueBgColor": "#F6F6F6","valueBgAlpha": "70","showValues": "0","showXAxisLine": "1","xAxisLineColor": "#000000","showYAxisLine": "1","sNumberSuffix": "%","theme": "fint"},"categories": [{"category": [{"label": "Q4'14"},{"label": "Q1'15"},{"label": "Q2'15"},{"label": "Q3'15"},{"label": "W21'15"},{"label": "W22'15"},{"label": "W23'15"},{"label": "W24'15"},{"label": "W25'15"},{"label": "W26'15"},{"label": "W27'15"},{"label": "W28'15"},{"label": "W29'15"},{"label": "W30'15"},{"label": "W31'15"},{"label": "W32'15"},{"label": "W33'15"}]}],"dataset": [{"dataset": [{"seriesname": "Total Sockets","data": [{"value": "1221049.4615"},{"value": "1173513.2308"},{"value": "1155593.6154"},{"value": "628820.9231"},{"value": "1187270"},{"value": "1202420"},{"value": "1204906"},{"value": "1207542"},{"value": "1207542"},{"value": "1207758"},{"value": "1207878"},{"value": "1210392"},{"value": "1213952"},{"value": "1221539"},{"value": "1222639"},{"value": "1223803"},{"value": "874469"}]}]},{"dataset": [{"seriesname": "Good Sockets","data": [{"value": "1205036.7692"},{"value": "1157653.9231"},{"value": "1139448.4615"},{"value": "620454.3077"},{"value": "1170948"},{"value": "1186091"},{"value": "1188573"},{"value": "1191204"},{"value": "1191204"},{"value": "1191420"},{"value": "1191540"},{"value": "1194054"},{"value": "1197614"},{"value": "1205273"},{"value": "1206609"},{"value": "1207787"},{"value": "863029"}]}]}],"lineset": [{"seriesname": "Effieciency","showValues": "1","data": [{"value": "98.6886"},{"value": "98.6486"},{"value": "98.6029"},{"value": "98.6695"},{"value": "98.6252"},{"value": "98.6420"},{"value": "98.6445"},{"value": "98.6470"},{"value": "98.6470"},{"value": "98.6472"},{"value": "98.6474"},{"value": "98.6502"},{"value": "98.6541"},{"value": "98.6684"},{"value": "98.6889"},{"value": "98.6913"},{"value": "98.6918"}]}]}});myChart.render();});
-
is there anyway for the parent chart to be click on page on load for its child chart to render??????????? or is there any way for the parent chart and the child chart to
render at the same time on page first onload?????????
-
Hi,
I am configuring my Linked Chart, Is there anyway that i can auto render the child chart of my Linked Chart when the page loads??????
what i want to happen is the Child Chart of my Linked chart renders at different container. I want my Parent Chart and my Child Chart render at the same time when the page loads. This is without clicking the Parent chart to render the child chart.................
Thank You very much.........
-
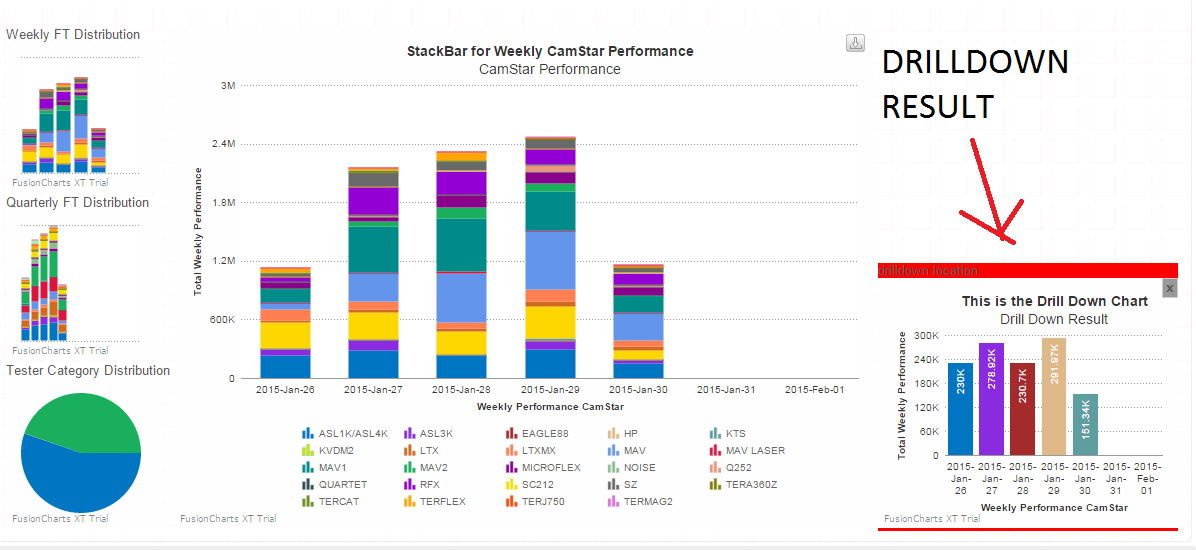
Hi Vishalika,
Thank You very much for your support I am now able to render Drill Down................
I am now improving my skills in Fusion Charts as of now I am able to render Thumbnail and Drill Down.
Now I am facing another problem..........
As i said I am rendering a Thumbnail the problem is how can I used the configureLink()
if I am rendering a Thumbnail...........
This is the way I will used my project
1. first the charts will load
2. i will click the thumbnails to render other chart to the big DIV
3. i will click the newly Render chart to see the Drill data of that chart
Again my question is how can I used the configureLink() especially i want to change the Chart Type
for example from StackBar to PieChar or from PieChart to ColumnChart
I will include my working codes with this i am able to render Drilldown but in only 1 chart..........
I wish i clearly explain my problem......... i am not really good at explaining things..........
Thank You Vishalika for the support...................
FusionCharts.ready(function(){var createThumbNail = function(chartId, width, height, divId) {var chartRef = FusionCharts(chartId),clonedChart = chartRef.clone({"width": width,"height": height});clonedChart.setChartAttribute({"showValues": "0","showLabels": "0","animation": "0","exportEnabled": "0","showTooltip": "0","showHoverEffect": "0","showYAxisValues": "0","caption": "","subCaption": "","xAxisName": "","yAxisName": "","showXAxisLine": "0","showYAxisLine": "0","numDivLines": "0","enableSlicing": "0","enableRotation": "0","showLegend" : "0"});clonedChart.addEventListener('chartClick', function() {FusionCharts(chartId).render('chart-container');});clonedChart.render(divId, 'append');};$.ajax({async: false,type: "GET",url : Drupal.settings.basePath + "fusion/json/daily",data : {},dataType: "json",success: function(data) {jsonDaily = data;}//end of success});$.ajax({async: false,type: "GET",url : Drupal.settings.basePath + "fusion/json/weekly",data : {},dataType: "json",success: function(data) {jsonWeekly = data;}//end of success});$.ajax({async: false,type: "GET",url : Drupal.settings.basePath + "fusion/json/pie",data : {},dataType: "json",success: function(data) {jsonPie = data;}//end of success});var weekly = new FusionCharts({"type": "msstackedcolumn2d","renderAt": "chart-container","width": "700","height": "500","dataFormat": "json","id": "chart1",//"dataSource": Drupal.settings.basePath + "/chartdata2.json""dataSource": jsonDaily});var quarterly = new FusionCharts({"type": "msstackedcolumn2d","renderAt": "chart-container","width": "700","height": "500","dataFormat": "json","id": "chart2",//"dataSource": Drupal.settings.basePath + "/chartdata2.json""dataSource": jsonWeekly});var Pie = new FusionCharts({"type": "pie2d","renderAt": "chart-container","width": "700","height": "500","dataFormat": "json","id": "chart3",//"dataSource": Drupal.settings.basePath + "/chartdata2.json""dataSource": jsonPie});// create thumbnails for all the three chartscreateThumbNail('chart1', 150, 150, 'thumbnail1');createThumbNail('chart2', 150, 150, 'thumbnail2');createThumbNail('chart3', 150, 150, 'thumbnail3');weekly.render();weekly.configureLink({type: 'column2d',width: '300',height: '250',renderAt: 'drill' ,overlayButton: {message: ' X ', // Set the button to show letter "X"bgColor:'#999999',borderColor: '#cccccc'}});}); // end of code
-
Hi Vishalika,
as of now i am studying drill down now i need a sample of drill down in pie chart i try to replicate the drill down in stackedbar but
i did not succeed. Can you give me a sample of drill down in pie chart????? more or less does Fusion Chart have a documentation of drill down
of all chart types?????? if any can you give me the link for that???
Thank You very much Vishalika
-
Hi,
Thank You so much Vishalika for your support! Gotta study this...........
-
Hi can anyone give me a sample or link of Stackbar Chart that use a Drill-Down???????? also the Drill Down Chart will appear in another DIV
Thank You Very much in advance..............
-
Hi,
Please update me if you have solved the issue using my method of getting the data via url method.....
I have another question here................. http://forum.fusioncharts.com/topic/16419-get-the-data-of-the-chart-and-plot-it-again-in-another-div/
I think it is like DRILL DOWN method but i want to display my drilldown in another DIV
is it possible in FusionChart??????? if it is possible can you give me a working sample or link so that i can study how it is created
Thank You Vishalika for your response.............
-
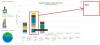
hi i just created a Thumbnail rendering in Fusion Chart................ I just want to ask if this is possible in Fushion Chart............
What i want to do is when i click the stack bar that I mark in rectangle i want to get that data and plot it again in another div using any chart that is available........ I wish i can post the image here in text area but I cant find a way to paste it here so i will just attach the image in the attached file.......... I just wanna clear what i want to accomplish. If I clicked the stacked bar in the Main Div the Biggest Chart I want to get the data in that
specific stackedbar and the plot it again in an another chart...... Is this possible in Fusion Chart?????? if possible can anyone give me an working example or link to a working sample.......... i will attach an image of what i want to create.... Thank You very much in advance
-
hi Vishalika i have posted a new question in the forum and i have attached my file.......... please see my codes another info it is a module in drupal............ thank you very much
-
Sorry for the repost i just attach the file for my work i wish i can get an immediate response.......
hi i am newbie in FusionCharts......... following samples in goes smoothly until i reach this problem...... i am following this sample http://docs.fusionch...s-of-chart.html My problem is the Thumbnail atttributes is not DISABLING........ the difference between my codes and the sample is the source of the data....... In my codes i am getting the json data from an external json file......... besides that difference nothing else differs...... more info my thumbnail resize it works....... it just the attributes are not disabling.......... it like i have small charts......... il post my codes here hope i can get an immediate response......... Thank You very much in advance..................
FusionCharts.ready(function(){var createThumbNail = function(chartId, width, height, divId) {var chartRef = FusionCharts(chartId),clonedChart = chartRef.clone({"width": width,"height": height});/////////////////////////////////////////////////////////////////////////////////////// i think this part of the codes is not working............/////////////////////////////////////////////////////////////////////////////////////clonedChart.setChartAttribute({"showValues": "0","showLabels": "0","animation": "0","exportEnabled": "0","showTooltip": "0","showHoverEffect": "0","showYAxisValues": "0","caption": "","subCaption": "","xAxisName": "","yAxisName": "","showXAxisLine": "0","showYAxisLine": "0","numDivLines": "0","enableSlicing": "0","enableRotation": "0"});/////////////////////////////////////////////////////////////////////////////////////// i think this part of the codes is not working............/////////////////////////////////////////////////////////////////////////////////////clonedChart.addEventListener('chartClick', function() {FusionCharts(chartId).render('chart-container');});clonedChart.render(divId, 'append');};var daily = new FusionCharts({"type": "msstackedcolumn2d","renderAt": "chart-container","width": "800","height": "500","dataFormat": "jsonurl","id": "chart1",//"dataSource": Drupal.settings.basePath + "/chartdata2.json""dataSource": Drupal.settings.basePath + Drupal.settings.fusion.link + "/js/jsondata/jsondataDaily.json"});var weekly = new FusionCharts({"type": "msstackedcolumn2d","renderAt": "chart-container","width": "800","height": "500","dataFormat": "jsonurl","id": "chart2",//"dataSource": Drupal.settings.basePath + "/chartdata2.json""dataSource": Drupal.settings.basePath + Drupal.settings.fusion.link + "/js/jsondata/jsondataQuarter.json"});// create thumbnails for all the three chartscreateThumbNail('chart1', 300, 300, 'thumbnail1');createThumbNail('chart2', 300, 300, 'thumbnail2');weekly.render();}); // end of code -
hi Vishalika Thank You for your immediate response......
The diference in our codes is that your sample is using json data WITHIN your FusionCharts.ready(function(){});
My requirement is to get the json data using EXTERNAL JSON FILE as shown in
"dataSource": Drupal.settings.basePath + Drupal.settings.fusion.link + "/js/jsondata/jsondataQuarter.json"
I think there is the problem between using an external file as a source of json data file.
because in my part the clonedChart.setChartAttribute() function is not working.
I want to disable all the attributes like in your sample so the thumbnail will look like an icon
can i send my file to you so that you can view my whole codes???????
-
hi i am newbie in FusionCharts......... following samples in goes smoothly until i reach this problem...... i am following this sample http://docs.fusioncharts.com/tutorial-how-to-guides-render-thumbnail-versions-of-chart.html My problem is the Thumbnail atttributes is not DISABLING........ the difference between my codes and the sample is the source of the data....... In my codes i am getting the json data from an external json file......... besides that difference nothing else differs...... more info my thumbnail resize it works....... it just the attributes are not disabling.......... it like i have small charts......... il post my codes here hope i can get an immediate response......... Thank You very much in advance..................
FusionCharts.ready(function(){var createThumbNail = function(chartId, width, height, divId) {var chartRef = FusionCharts(chartId),clonedChart = chartRef.clone({"width": width,"height": height});/////////////////////////////////////////////////////////////////////////////////////// i think this part of the codes is not working............/////////////////////////////////////////////////////////////////////////////////////clonedChart.setChartAttribute({"showValues": "0","showLabels": "0","animation": "0","exportEnabled": "0","showTooltip": "0","showHoverEffect": "0","showYAxisValues": "0","caption": "","subCaption": "","xAxisName": "","yAxisName": "","showXAxisLine": "0","showYAxisLine": "0","numDivLines": "0","enableSlicing": "0","enableRotation": "0"});/////////////////////////////////////////////////////////////////////////////////////// i think this part of the codes is not working............/////////////////////////////////////////////////////////////////////////////////////clonedChart.addEventListener('chartClick', function() {FusionCharts(chartId).render('chart-container');});clonedChart.render(divId, 'append');};var daily = new FusionCharts({"type": "msstackedcolumn2d","renderAt": "chart-container","width": "800","height": "500","dataFormat": "jsonurl","id": "chart1",//"dataSource": Drupal.settings.basePath + "/chartdata2.json""dataSource": Drupal.settings.basePath + Drupal.settings.fusion.link + "/js/jsondata/jsondataDaily.json"});var weekly = new FusionCharts({"type": "msstackedcolumn2d","renderAt": "chart-container","width": "800","height": "500","dataFormat": "jsonurl","id": "chart2",//"dataSource": Drupal.settings.basePath + "/chartdata2.json""dataSource": Drupal.settings.basePath + Drupal.settings.fusion.link + "/js/jsondata/jsondataQuarter.json"});// create thumbnails for all the three chartscreateThumbNail('chart1', 300, 300, 'thumbnail1');createThumbNail('chart2', 300, 300, 'thumbnail2');weekly.render();}); // end of code

Combo chart (Column + Line) using PHP and MYSQL data
in FusionCharts and PHP
Posted · Report reply
Hi Philippeb did u receive my email???