
omegat29
-
Content count
8 -
Joined
-
Last visited
Posts posted by omegat29
-
-
Dear all
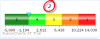
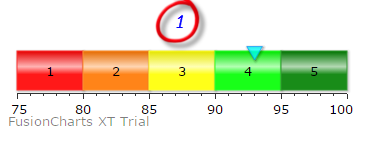
I have some problem about color range of horizontal linear gauge.
I define 5 colors range and get range value via database, if range value sort by ascending color will shown as pic.1 (red, orange, yellow, lime, green).
and If range value sort by descending color will shown as pic.2 (green, lime, yellow, orange, red).
How to fix color range for horizontal linear gauge. (not related to database)
Thanks alot

-
Hi
Thank you for help.
I try to success for render multiple gauges by using 1 record.
This's my code as below.
<?php$link = connectToDB();$strQuery = "select * from gauge";$result = mysql_query($strQuery) or die(mysql_error());while ($ors = mysql_fetch_array($result)) {$strJSON = '{"chart": {"manageresize": "1", "origw": "350", "origh": "200", "palette": "2", "bgalpha": "0", "bgcolor": "FFFFFF", "numbersuffix": "", "showborder": "0", "basefontcolor": "000000", "charttopmargin": "5", "chartbottommargin": "5", "tooltipbgcolor": "009999", "gaugefillmix": "{dark-10},{light-70},{dark-10}", "gaugefillratio": "3", "pivotradius": "8", "gaugeouterradius": "120", "gaugeinnerradius": "70%", "gaugeoriginx": "175", "gaugeoriginy": "170", "trendvaluedistance": "5", "tickvaluedistance": "3", "managevalueoverlapping": "1", "autoaligntickvalues": "1", "showvalue":"1", "valuebelowpivot":"1", ';$strJSON .= '"caption": "' . $ors['gauge_name'] . '", "subcaption": "' . $ors['gauge_subname'] . '", "lowerlimit": "' . $ors['min_value'] . '", "upperlimit": "' . $ors['max_value'] . '"';$strJSON .= '}, "colorrange": {"color": [';$strJSON .= '{"minvalue": "' . $ors['g1'] . '", "maxvalue": "' . $ors['g2'] . '", "code": "FF654F"},';$strJSON .= '{"minvalue": "' . $ors['y1'] . '", "maxvalue": "' . $ors['y2'] . '", "code": "F6BD0F"},';$strJSON .= '{"minvalue": "' . $ors['r1'] . '", "maxvalue": "' . $ors['r2'] . '", "code": "8BBA00"}';$strJSON .= ']},"dials": {"dial": [{';$strJSON .= ' "value": "' . $ors['dial_value'] . '"';$strJSON .=',"rearextension": "12","basewidth": "10"}]}, "trendpoints": {"point": [{';$strJSON .= '"startvalue": "' . $ors['target'] . '"';$strJSON .=',"displayvalue": "Target dia ","usemarker": "1","markerradius": "8","dashed": "1","dashlen": "2","dashgap": "2"}]}}';// echo $strJSON . "<br><br>";FC_SetDataFormat("json");// echo renderChart("angulargauge", "", $strJSON, $ors['id'], "100%", "100%");echo renderChart("angulargauge", "", $strJSON, $ors['id'], 300, 200);}mysql_close($link);?>So, now I have some question
1. Can I add text label for color range as Linear gauge?
2. Can I change font color for dial value and trendpoint value?
Thanks for advance.

-
Hi Vishalika
Thanks for your kindness.
I trying to develop project (multi KPI gauge on same page) for all record, but not success. The gauges shown incorrect information, it appear information from one record.
So please help fix the problem.
Thanks in advance.
 <?php$link = connectToDB();// $i = 0;// $query = "select id from gauge";// $id = mysql_query($query) or die(mysql_error());$strQuery = "select * from gauge";$result = mysql_query($strQuery) or die(mysql_error());$total = mysql_num_rows($result);// while($i<$total){for($i=0; $i < $total; $i++) {// $i++;while ($ors = mysql_fetch_array($result)) {$strJSON = '{"chart": {"manageresize": "1", "origw": "350", "origh": "200", "palette": "2", "bgalpha": "0", "bgcolor": "FFFFFF", "numbersuffix": "", "showborder": "0", "basefontcolor": "000000", "charttopmargin": "5", "chartbottommargin": "5", "tooltipbgcolor": "009999", "gaugefillmix": "{dark-10},{light-70},{dark-10}", "gaugefillratio": "3", "pivotradius": "8", "gaugeouterradius": "120", "gaugeinnerradius": "70%", "gaugeoriginx": "175", "gaugeoriginy": "170", "trendvaluedistance": "5", "tickvaluedistance": "3", "managevalueoverlapping": "1", "autoaligntickvalues": "1", "showvalue":"1", "valuebelowpivot":"1", ';$strJSON .= '"caption": "' . $ors['gauge_name'] . '", "subcaption": "' . $ors['gauge_subname'] . '", "lowerlimit": "' . $ors['min_value'] . '", "upperlimit": "' . $ors['max_value'] . '"';$strJSON .= '}, "colorrange": {"color": [';$strJSON .= '{"minvalue": "' . $ors['g1'] . '", "maxvalue": "' . $ors['g2'] . '", "code": "FF654F"},';$strJSON .= '{"minvalue": "' . $ors['y1'] . '", "maxvalue": "' . $ors['y2'] . '", "code": "F6BD0F"},';$strJSON .= '{"minvalue": "' . $ors['r1'] . '", "maxvalue": "' . $ors['r2'] . '", "code": "8BBA00"}';$strJSON .= ']},"dials": {"dial": [{';$strJSON .= ' "value": "' . $ors['dial_value'] . '"';$strJSON .=',"rearextension": "12","basewidth": "10"}]}, "trendpoints": {"point": [{';$strJSON .= '"startvalue": "' . $ors['target'] . '"';$strJSON .=',"displayvalue": "Target","usemarker": "1","markerradius": "8","dashed": "1","dashlen": "2","dashgap": "2"}]}}';}// echo $strJSON;FC_SetDataFormat("json");echo renderChart("angulargauge", "", $strJSON, "$i", 500, 300);// echo renderChart("bar3d", "", $strJSON, "chart2", 500, 300);// echo renderChart("angulargauge", "", $strJSON, "chart3", 500, 300);}mysql_close($link);?>
 -
Hi,
The sample contains how JSON data is used in PHP+MySQL sample.
If you require any further assistance do let us know.
Hi VishalikaThank you very much for your helping.I have some question as below.1. What is the difference between FC_SetDataFormat() from lates example and json_encode() from tutorial topic:Creating Charts with Data from a Database ?2. How many maximum of chart in same page on the trial version? (My project is multi KPI gauge in same page.)Thank you very much.Theerapat -
Hi
Thank you for your help.
I'm trying to apply your code from pie chart to angular gauge.
If successful, I will let you know.
Thank you very much.

-
Dear VishalikaThank you very much for your help.It is coded using xml, wonderful and perfect.If I would like to use json code to improve knowledge, please explain again.I hope to get help from you again.Thanks in advance.)Best RegardTheerapat -
Dear all
I would like to create angular gauge, How to config parameter of gauge from database (such as value, min, max, angular start-storp etc.) into php project.
To improve the project in accordance with the information and impressions.If there is a way, please explain to know.Thank you for advice.


switch value between upperlimit and lowerlimit
in Using FusionWidgets XT
Posted · Report reply
Dear all
How to switch attribute value between upperlimit and lowerlimit of horizontal linear gauge?
For example, the upper limit is 0 and the lower limit is 100.
Thanks.