.jpg.ae9e1f229133e3605c71451eafea7f07.jpg)
Prerana
-
Content count
204 -
Joined
-
Last visited
Posts posted by Prerana
-
-
Hello,Thanks for the query.For your 1st problem i.e. If lower limit value is not a zero then position of trend point label is wrong.Sol - This issue has been already logged internally, will keep you posted.For the query i.e. How can I reduce chart margins?Sol - There are attributes to set chart margin, please go through our docs for the details - http://www.fusioncharts.com/dev/chart-attributes.html?chart=angulargauge&attributeName=chart_chartRightMarginand kindly refer the fiddle given below for the implementation.
-
Hello,Thanks for the query.Showing/hiding any specific bubble is not feasible, however you can show/hide the entire data series using legend.Hope this helps,
-
Hello,
Thanks for replying back.
Your issue is not being replicated from our end, so we will arrange a remote session for you.
Kindly drop us mail at [email protected] with the details of the issue and your convenient time for the session.
Hope this helps,
-
Hello,Thanks for replying back.We have used the code provided by you, still the issue is not being replicated.Kindly refer the screenshot and the sample attached for the implementation.Hope this helps,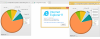
-
Hello,Thanks for the query.The issue is not replicated from our end, its working as expected.Kindly refer the sample below for the implementation.
Please note, legends are not applicable to single series chart.Please let us know whether you are using the current version or the older one.Hope this helps, -
Hello,
Kindly send us the scale down sample, so that we can replicate the issue.
-
Hello,
Kindly try this on another system, because Its working as expected from our end in IE11 with FusionCharts Suite v3.11.3.
Hope this helps,
-
Hello,
Thanks for the query.For the first query, i.e. In IE(version IE11), there are only 4 options of export available: (PNG, JPG, PDF, SVG).Ans. Its showing all the five options i.e. PNG, JPG, PDF, SVG, XLS.Here is the screenshot attached. Kindly refer the fiddle below to replicate the same.For the second query, i.e. In the exported XLS, the label information (which has a comma in it) is being chopped off.Ans. We have logged a bug for the same, will keep you posted.Hope this helps,
-
Hello,
Thanks for the query.
Please include the FusionCharts' library file before calling FusionCharts.ready function.
Kindly find the modified sample attached below.
Hope this helps,
-
Hello,
Glad to inform you that the issue has been resolved in our current version i.e. FusionCharts Suite v3.11.3.
Kindly refer the fiddle below for the implementation.
http://jsfiddle.net/Prerana/fegf4zp5/8/
Hope this helps,
-
Thanks for pointing this out. My graphs were not loading without the net connection.
Hello,
Glad to know that it worked.

-
Hello,
Glad to know that it worked.
-
Hello,Thanks for the query.Kindly change the chart type from "Line" to "MSLine", as it is a multiseries chart.The flash version is deprectated. Kindly upgrade to the current version.Kindly refer the sample attached, for the implementation.Hope this helps,
-
Hello,Thanks for replying back.Your requirement is achievable using our new feature smartlabel.Using smartlabel you can achieve the following features:- If a bound box is provided it wraps / truncates the text
- Calculate the metrics (height and width) of text for any style
- Add ellipses if the text is truncated
- Wraps a label in the bound box
For further details about smartLabel, kindly refer the github link given below.
Kindly refer the fiddle below for the implementation.
Hope this helps, - If a bound box is provided it wraps / truncates the text
-
Hello,
Thanks for replying back.
The automatic wrapping of the text is not supported in JS chart due to certain limitations.
Hope this helps,
-
Hello,
Your requirement is achievable. Kindly use "canvasLeftMargin" attribute to get the alignment.Kindly refer the fiddle below for the implementation.Hope this helps, -
Hello,
Thanks for the query.
Unable to replicate your scenario.
Kindly modify the sample given below or share an image, so that we can replicate your requirement.
-
Hello,
It is not feasible.
-
Hello,There is no attribute available to avoid radialGradient tag as of now.We have logged an improvement request for it internally and will keep you posted. -
Hello,PhantomJS is a third party tool and we cannot control the export done by it.Though you can send us a scaled down sample and screenshots for the issue you are facing, so that we can replicate the issue, and get feedback from respective team.Hope this helps,
-
Hello,Kindly download FusionCharts Suite XT, using the link given below.
This suite contains all the required js files. Extarct those files, and use them as per your requirement.Hope this helps,
-
Hello,
Thanks for the query.The combination of bar chart and line chart is not supported.Instead of bar chart , you could use the combination of column chart and line chart.Kindly refer the link below, for the implementation.Hope this helps, -
Hello,The attribute "placeValuesInside" is not supported by stacked bar chart type.As it is a stacked chart type, ie one plot will come over another plot, so placing value out side won't be a good visualisation.You can show value inside the plot, by setting the attribute "showValues" as 1 at the chart level.In your case, you can use text annotation, as the plots are in opposite direction.Using text annotations, you can add notes, labels, or any other contextual text information that you may want to make available inside the chart at any position.For more detatils about annotation, please refer the Fusioncharts documentation links given below.
Kindly refer the fiddle below for the implementation.
Hope this helps,
-
Hello,Thanks for the query.Kindly use annotation and its event (annotationClick, annotationRollOver, annotationRollOut) to achieve your requirement, ie add an icon to the chart with hover effect and click event.For more details about annotation, visit the links given below.
Kindly refer the fiddle below for the implementation.
Hope this helps,


Angular Chart Trend point label wrong position
in Bug Reports
Posted · Report reply