
Akash Biswas
-
Content count
417 -
Joined
-
Last visited
Posts posted by Akash Biswas
-
-
Hi Vicky,
The API method "configureLink()" is not used properly. It does not need the render() method to be invoked with the configureLink() as in the provided snippet.
Please use it as below :
drilldownobj.configureLink({
        type: "pie2d",
        overlayButton: {
            message: 'Back to parent chart',
            bgColor: '#999999',
            borderColor: '#cccccc'
        }
    });
You can also refer to a sample fiddle : http://jsfiddle.net/fusioncharts/zdewk96j/
Please find the configureLink() API method reference in the list : https://www.fusioncharts.com/dev/api/fusioncharts/fusioncharts-methods
Thanks,
Akash.
-
Hi,
This issue would be fixed in the future release version. We would notify you with the updates via this forum thread.
Thanks,
Akash.
-
Thanks for the acknowledgement
")
-
Hi Ravi,
We have checked rendering a chart using FusionCharts Angular plugin with the mentioned export configuration as below :
"exportEnabled": "1",
"exportMode": "client" [Same as "exportAtClient" which is now deprecated]
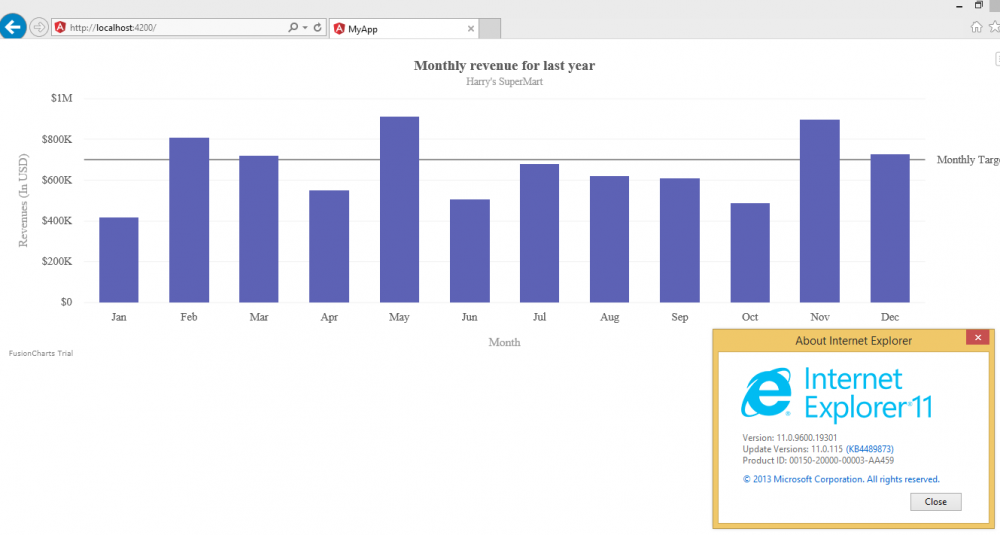
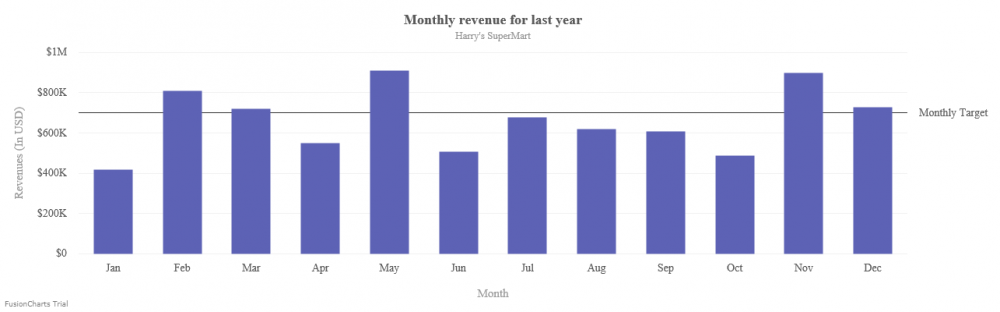
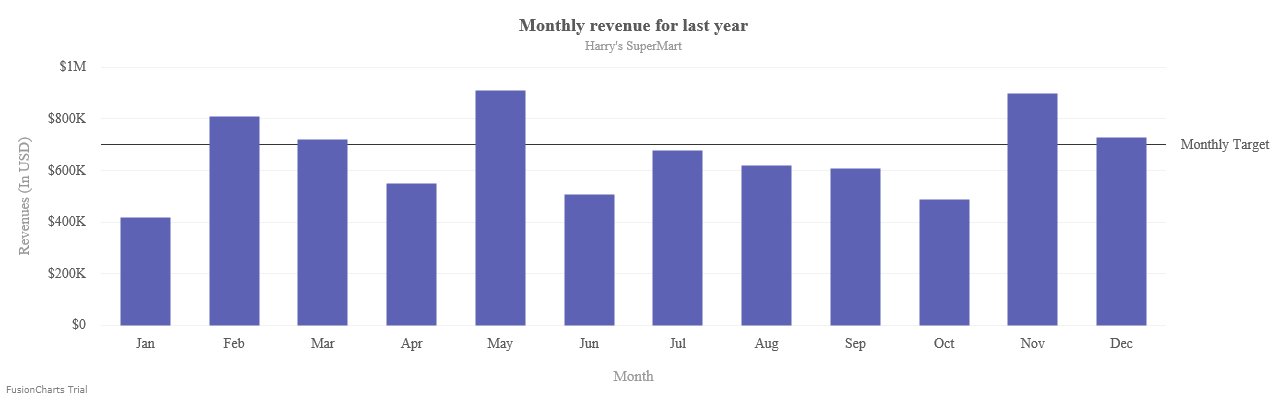
Please find the attached screenshot for the exported files(PNG, JPG, PDF, SVG) from the chart rendered in IE :
Also check the Angular sample in the below DropBox link :
https://www.dropbox.com/s/k2l7ipipcjnev2m/my-app-angular.zip?dl=0
Thanks,
Akash.

-
Hi Ravi,
We are able to download(export) the charts in all the supported formats with charts rendered in IE browser. Please find the below sample fiddle which is working fine in IE browser.
Sample fiddle : http://jsfiddle.net/r71nfkgv/3/ (version - 3.13.4)
Please let us know if you are using the current version, and replicate the problem in a scaled down sample so that we can check it at our end.
Thanks,
Akash.
-
Hi,
Please let us know how you are using Multi Axis Line Chart with Date range changing option. We are not getting any error with the native multi-axis line chart as below :
http://jsfiddle.net/fusioncharts/aPHB5/
Documentation link :https://www.fusioncharts.com/dev/chart-guide/standard-charts/multi-axis-line-chart
Thanks,
Akash.
-
Hi,
FusionCharts render charts with the provided dataSource by the user in the FusionCharts constructor.
Now to include the dataset in the dataSource based on your fetched or received data, you need to generate the dataSource dynamically in the prescribed format accordingly, before providing it to the FusionCharts constructor.
If you want to change the chart data, check this documentation for reference : https://www.fusioncharts.com/dev/getting-started/plain-javascript/configure-your-chart-using-plain-javascript
Thanks,
Akash.
-
Hi Ravi,
The horizontal axis in a Bar chart is a numeric axis and it does not support the date and month representation. The numeric value set using the "value" attribute of the "data" objects are plotted with respect to the y-axis scale on the chart.
As a work-around, if you want to display the date and month on the plots, you can set your custom string in the "displayValue" attribute within the data objects, which will be displayed on the plots instead of the actual values.
Please note : The "value" attribute accepts numeric values only.
Please check the sample fiddle for reference : https://jsfiddle.net/17ucrpdx/3/
Thanks,
Akash.
-
Hi Ravi,
The Bar and Column chart types render chart with values mapped to the respective category labels. The values does not represent dates data in bar and column charts.
However, the value 2013 will be displayed as 2K, due to the default number scale formatting feature of FusionCharts. You can disable it to display 2013 as simply 2013 with out scaling and formatting by setting "formatNumber" and "formatNumberScale" to "0".Refer to this sample fiddle : http://jsfiddle.net/gudts7cw/4/
Thanks,
Akash.
-
Hi Matt,
We are looking into this, we would get back to you if there are any updates.
Thanks,
Akash.
-
Glad to know that.
Thanks for the acknowledgement.
-
Hi Anil,
Set the attribute set usePlotGradientColor as 0 in your chart dataSource.
Also check the supported attribute list for reference : https://www.fusioncharts.com/dev/chart-attributes/MSArea
Thanks,
Akash.
-
Hi Sarah,
As of now the exact combination of stacked columns with area plots in a dual y-axis chart is not supported. Though the 2D variant is available for the shared chart type.
The available charts are as below :
msstackedcolumn2dlinedy (dual y-axis)
stackedcolumn2dline (single y-axis)
stackedcolumn3dlinedy (dual y-axis)
Please check the documentation link for reference : https://www.fusioncharts.com/dev/chart-guide/standard-charts/combination-charts
Thanks,
Akash.
-
Hi Manoj,
You can set the attribute "numberPrefix" to add a string before the numeric values on the chart. Please find a sample Spline chart using the mentioned attribute : http://jsfiddle.net/aoegjp8h/3/
Also refer to the documentation link for number prefix or suffix configurations : https://www.fusioncharts.com/dev/chart-guide/chart-configurations/number-format#add-number-prefix-and-suffix
Thanks,
Akash.
-
Hi,
To render any chart by fetching values from database, you need to use any of the server-side wrappers provided by FusionCharts. You can check the supported wrappers in this link : https://www.fusioncharts.com/integrations?stack=back-end-integrations
Documentation link : https://www.fusioncharts.com/dev/getting-started/php/your-first-chart-using-php
Also find a sample multi-series chart rendered by fetching values form database using the JAVA wrapper : https://www.dropbox.com/s/5vd6hdmjiqx6yp8/DemoWrapperMultiSeriesCharts.zip?dl=0
Please note : Stacked charts and multi-series charts have same dataSource structure. So you can render the above chart as stacked chart by changing the chart "type" to "stackedcolumn2d".
Kindly refer to the sample and implement accordingly by referring to the provided documentation link.
Thanks,
Akash.
-
Hi,
Thanks for the acknowledgement. We are glad to know that your problem is solved.
Thanks,
Akash.
-
Hi,
Hope this mail finds you well.
Thank you for your continued patience.
For the issue reported, could you please upgrade your current version to the latest, i.e, FusionCharts Suite XT v3.13.4?
To avail the licensed release, you would need to re-download the entire package from the My Orders section of FusionCharts Product Update Center. PUC URL: https://puc.fusioncharts.com/
To download the Evaluation version of FusionCharts Suite XT v3.13.4, please visit the link: https://www.fusioncharts.com/download/fusioncharts-suite-xt
Thanks,
Akash.
-
Hi Hendra,
Thank you for your continued patience.
For the issue reported, could you please upgrade your current version to the latest, i.e, FusionCharts Suite XT v3.13.4?
To avail the licensed release, you would need to re-download the entire package from the My Orders section of FusionCharts Product Update Center. PUC URL: https://puc.fusioncharts.com/
To download the Evaluation version of FusionCharts Suite XT v3.13.4, please visit the link: https://www.fusioncharts.com/download/fusioncharts-suite-xt
Thanks,
Akash.
-
Hi,
Hope this mail finds you well. Thank you for your continued patience.
For the issue reported, could you please upgrade your current version to the latest, i.e, FusionCharts Suite XT v3.13.4?
Please note : You need to set the attribute "applycsstransform" to "1". Find a sample fiddle for reference - http://jsfiddle.net/rn8pcxq2/
To avail the licensed release, you would need to re-download the entire package from the My Orders section of FusionCharts Product Update Center. PUC URL: https://puc.fusioncharts.com/
To download the Evaluation version of FusionCharts Suite XT v3.13.4, please visit the link: https://www.fusioncharts.com/download/fusioncharts-suite-xt
Thanks,
Akash.
-
Hi,
Thank you for your continued patience.
For the issue reported, could you please upgrade your current version to the latest, i.e, FusionCharts Suite XT v3.13.4?
To avail the licensed release, you would need to re-download the entire package from the My Orders section of FusionCharts Product Update Center. PUC URL: https://puc.fusioncharts.com/
To download the Evaluation version of FusionCharts Suite XT v3.13.4, please visit the link: https://www.fusioncharts.com/download/fusioncharts-suite-xt
Thanks,
Akash.
-
Hi Narasimha,
FusionCharts have specific charts supporting scroll feature. Please check the documentation link for the supported chart types :
https://www.fusioncharts.com/dev/chart-guide/standard-charts/scroll-charts
Please note :
Stacked column plots supporting scroll feature available in Scroll Stacked Column 2D Chart,
Combination plots(not stacked) supporting scroll feature available in Scroll Combination 2D Chart
Bar(horizontal) charts or stacked with line chart do not support scroll feature.
Thanks,
Akash.
-
Hi Phil,
Thanks for the acknowledgement.
-
Hi,
In your implementation, eval(document.getElementById('screenh').value) is not fetching any value, hence the chart is not getting any value for the height parameter. Please check the modified sample attached here in this response.
You can refer to any of the online materials or forums to for reference to fetch browser height, and implement accordingly. Example :
https://stackoverflow.com/questions/3333329/javascript-get-browser-height
Thanks,
Akash.
-
Hi Sebastien,
Thanks for pointing this, we were able to replicate the issue in Stacked bar chart when "stack100percent" is set to "1". So, we have logged this as an issue internally, and the concerned team will be working on it. We will keep you posted with the updates.
Thanks,
Akash.


Uncaught TypeError: Cannot read property 'areaovercolumns' of undefined
in Miscellaneous
Posted · Report reply
Hi Harita,
Could you please provide a scaled down sample replicating the issue so that we can check it at our end.
You could provide your implementation with the issue by modifying the sample : https://codesandbox.io/s/v85m1nzq9y
Thanks,
Akash.