
jgee
-
Content count
9 -
Joined
-
Last visited
Posts posted by jgee
-
-
Hello,
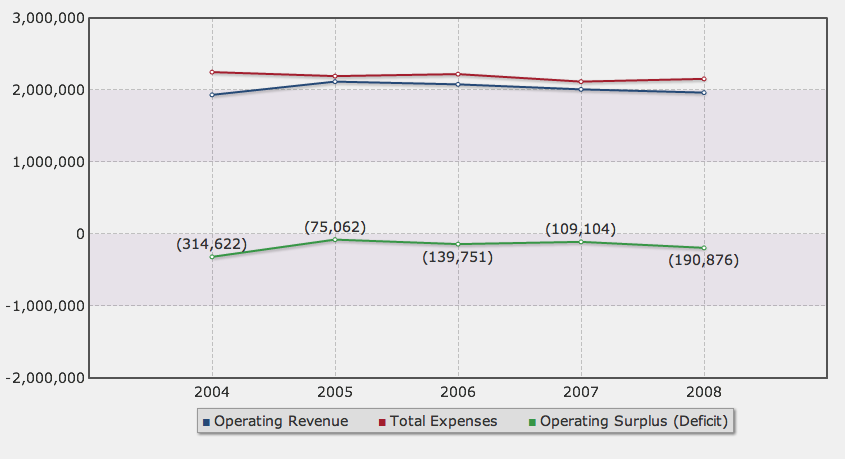
I have a multi-series line chart and trying to add color (red) formatting for negative values. I am using the displayValue attribute to format my plotted values inside parentheses but can't seem to then get the color attribute to affect that displayed text. Setting the value to red instead changes the color of the line--not the displayed value.
Here is what I tried:
dataset seriesName='Operating Surplus (Deficit)'
set value='' /
set value='-314622' displayValue='(314,622)' color='CC3300' /
set value='-75062' displayValue='(75,062)' color='CC3300' /
set value='-139751' displayValue='(139,751)' color='CC3300' /
set value='-109104' displayValue='(109,104)' color='CC3300' /
set value='-190876' displayValue='(190,876)' color='CC3300' /
set value='' /
/dataset
But the color value was applied to the line rather than the displayed value, so I have removed it.
Also, if there is a better way to create the margin between the first plotted point and y-axis and last plotted point and right side of chart, let me know. Currently adding empty values and 2 non-displaying series as a hack to achieve this.
Thanks for any help!
-
I am wondering if perhaps I could somehow use the FLA files to create dynamic SVG graphics for the print versions. Is the only way to get access to FLA source files to purchase an Enterprise license--currently I have a Developer's license.
Also I looked very quickly through the .Net docs but did not see any reference to the workaround you mention--could you point me to an example?
Thanks again for your help!
-
I have read through the forums and it seems there is no direct way to generate charts without first rendering a containing HTML page within the browser. Still, I have setup a client with FusionCharts who is now creating beautiful database-driven web reports but would now love to batch generate PDF versions of these files. Printing each individually from the browser is not an option because of the various browser issues documented around the scalable charts and the number of reports (1000's) he would like to create.
Can you recommend any starting point for me if I want to try to combine some technologies to achieve this? I did run across a thread that mentioned something for .Net but have seen no methods mentioned for PHP. Perhaps I could combine the XML output of my FusionCharts PHP Class with SVG somehow, or render the chart images in advance and have the PDF dynamically include them...
Thanks for any ideas or other threads that might get me started.
-
works perfect and now that i know what to look for i easily found the param in the docs

thanks for your quick help!
-
I have a client who would like to prevent the tooText field from displaying in the bar charts we are using. I have tried setting it to an empty value, to zero, etc. to no avail and have been unable to find this covered in docs. Can you tell me if there is a solution or where to find in docs?
Thanks much,
John
-
thanks so much for your help!
-
Probably a newbie question but having trouble enabling debugMode within charts I am building using the PHP Class. I have tried 2 ways, neither successful:
1. as a param in the constructor, ie:
$FC = new FusionCharts("MSColumn3D", "800", "600", "1", "1");
2. as part of the param string passed to setChartParams, ie:
$FC->setChartParams("...;debugMode=1;...");
Can somebody tell me what I am doing wrong? I can get it to work when setting explicitly through javascript in other charts. Thanks...
-
Is that the same for all FusionGadgets (I will be using the Pyramid and the Speedometer specifically), that they cannot be generated by PHP Class, and that we should instead reference the functions used in the Blueprint demo?
Thanks in advance for your help,
john
Adding color to displayValue in multi-series line chart
in FusionCharts and PHP
Posted · Report reply
Thanks for your help--this is great to know!