
Dave Raiman
-
Content count
2 -
Joined
-
Last visited
Posts posted by Dave Raiman
-
-
We've just upgraded our FusionCharts to the current version and I've run into a snag with the x-axis labels not all showing on the plots. It appears that FC dynamically determine how many labels to display based on display space. The problem is that it's very erratic sometimes showing even just one label. Other size windows will show a block of labels in the middle of the axis. I've used showLabels='1' labelDisplay='rotate' labelStep='1' attributes. If I change to labelDisplay='NONE' then all labels are shown horizontally and, of course, they all smash together if the window is too small. I was able to reproduce the error condition in this fiddle: https://jsfiddle.net/daver1212/favpmwco/11/. The screen captures attached are from execution of this fiddle with different window sizes.
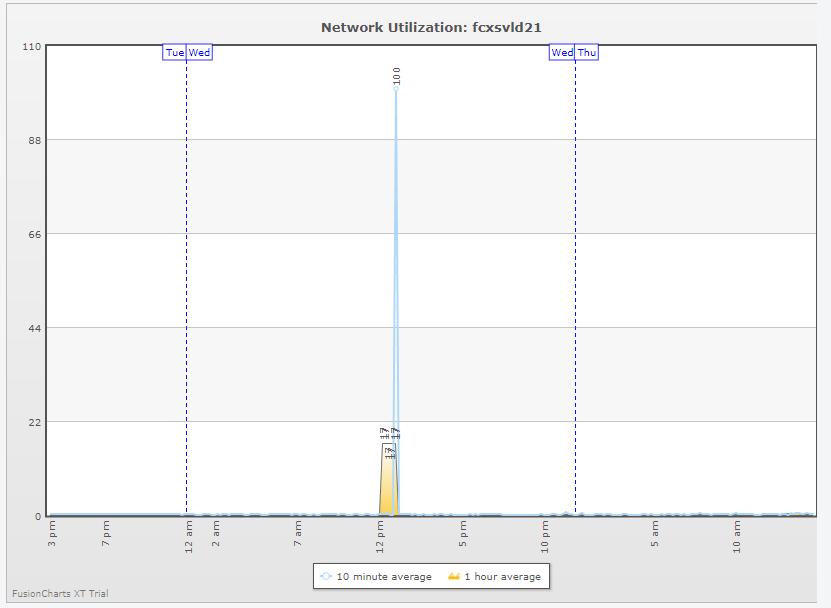
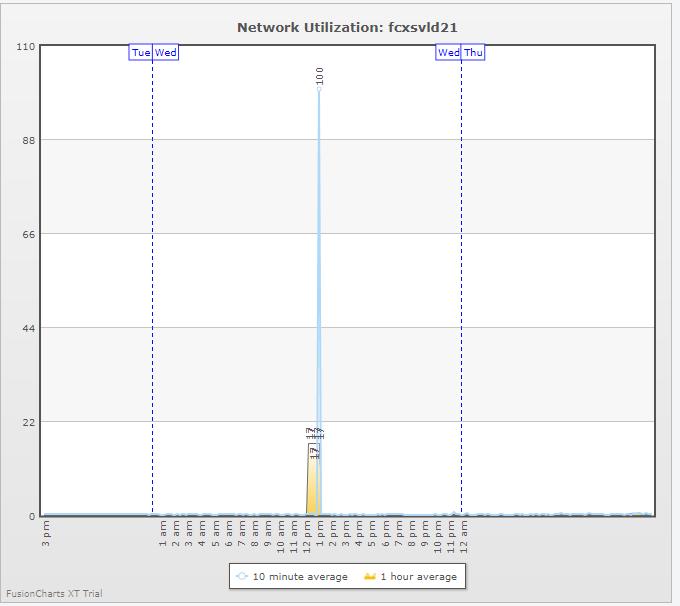
Missing x-axis labels
in General usage
Posted · Report reply
I would love it if FC would dynamically adjust the labels based on the amount of space available in a consistent way. The two solutions you offered (thanks for that!) both forced static quantity of labels. In my example, FC is changing the labels showing (desirable) but doing so very erratically.
Neither one of those seems like reasonable expected output. If I have to, I'll code to manually show a specific number of visible labels based on the smallest normal width as we did in the older version but it seems like the dynamic labeling isn't working correctly leaving "random" labels out. In the current case, we have 48 labels (one for each hour) on approximately 288 categories (6 data points per hour) which would fit easily on my 4k monitor and fits, though more tightly, on a 1920 window.