
Tevin.Davis
-
Content count
4 -
Joined
-
Last visited
Posts posted by Tevin.Davis
-
-
10 hours ago, Ayan Bhadury said:Thanks for replying back, from the above sample image, it seems like you are using scatter chart, I have created a sample for you where I have specified the x-axis limits on a scatter chart, please check the sample fiddle for reference - http://jsfiddle.net/A4kc2/66/
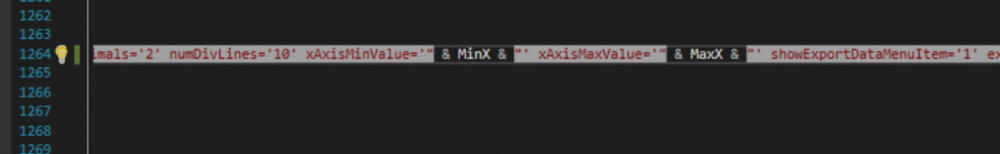
Doesn't seem that the chart is rendering there. Looking at the code, where are you setting the thousand and decimal separator?
-
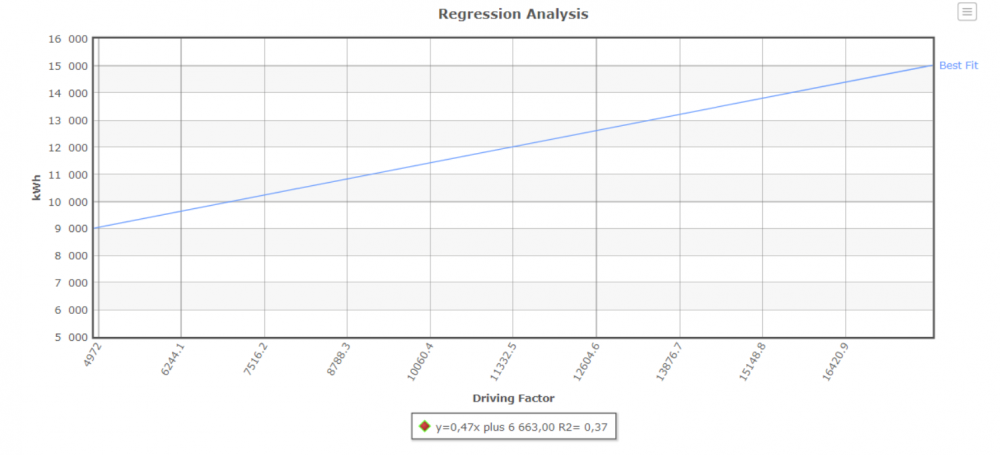
Thanks for reaching back out so quickly, I am not sure off the fusion chart given name for this chart but I have included a picture of the chart with the issue I am facing. If there is any other information that I can give to help solve this problem please let me know.
-
Hey guys I am extremely new to Fusion Charts and I am doing some consulting and have ran into Fusion Charts. I am doing some localization work so I set the thousand separator and decimal separator and have that working on all my charts. On this one particular chart, we set the chart limits. On this chart, the x-axis no longer has its number format but the y-axis still does. I have tried passing the chart formatted x-axis min and max and that breaks. Is there something I can do so that my number formatting applies to the charts that have set chart limits?

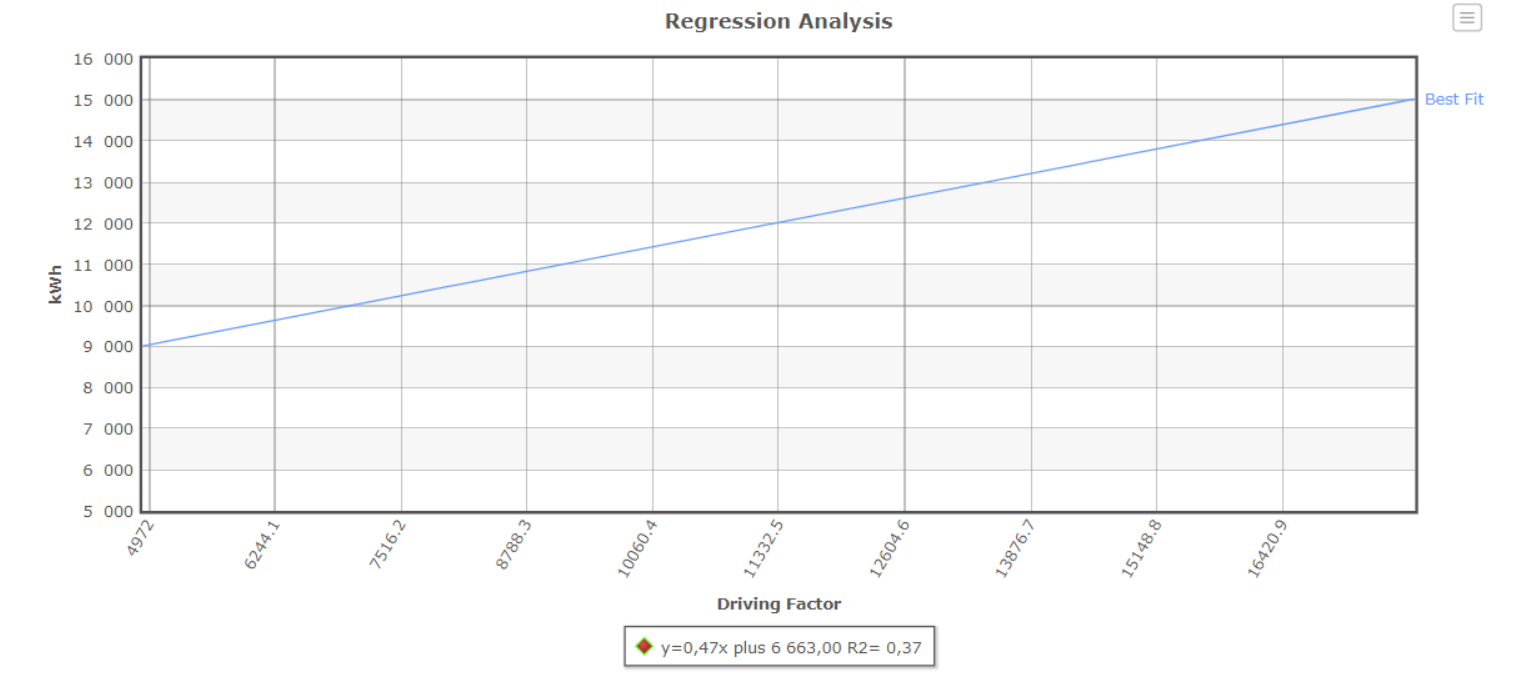
Chart Limits Number Formating
in FusionCharts and ASP.NET
Posted · Report reply
It is rendering now for me, Can you set the thousand separator to a space and the decimal separator to a comma on the x-axis