
zhenghaoju
-
Content count
47 -
Joined
-
Last visited
Posts posted by zhenghaoju
-
-
Thanks again, I think fusionchart XT document should tell us about default canvas padding value.

-
-
-
I update the fusionchart3.2 to XT version, I found Stacked 2D Area Chart style changed, please see the picture
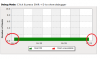 ,The chart display the blank on chart left and right sides. please help me to solve it.
This is my debug informations: debugInfos.txt
-
I update the fusionchart3.2 to XT version, I found Stacked 2D Area Chart style changed, please see the picture
,The chart display the blank on chart left and right sides. please help me to solve it.The debug informations : debugInfos.txt
-
I update the fusionchart3.2 to XT version, I found Stacked 2D Area Chart style changed, please see the picture
,Why chart display the blank on chart left and right sides? please help me to solve it.
-
Hi,
Can you please elaborate on your requirement, a bit more?
I want to show 5000 hosts CPU utilization heat map. I want to know heat map chart performance.
-
Hi, I want to know heat map chart support max block number.

-
Hi,
Can you paste your sample code and XML here? so that we can test it at our end.
Sorry, I can not supply the xml file, but I study this problem, I think may be flash problem.
-
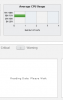
Hi , I used the fusion charts in our dashboard, we should refresh this page in every 1 min.
But in IE8 and IE9, after several times refresh, the fusion chart crashed.
see the png.
IE8
IE9
-
Hi all,
I try to change the flash chart to Javascript chart in our project.
I found the javascript chart performance is low when show 6 charts together or above 6.
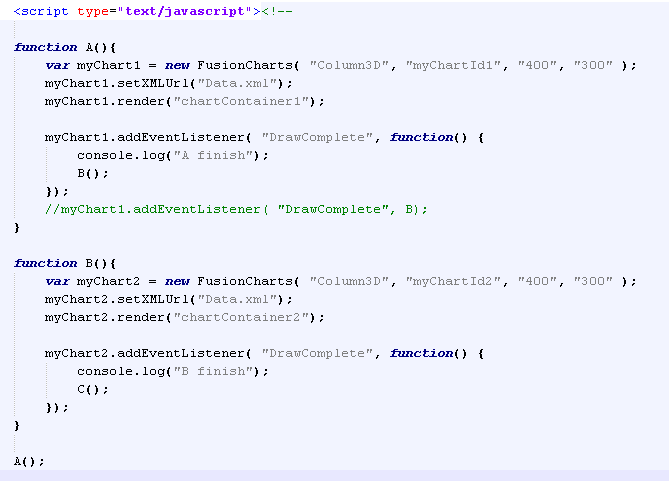
So I decide to change show chart way. like when first chart draw complete, the second chart start to draw, see the code:
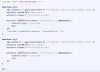
this way can improve chart performance in browser, but the code is so bad. I want to know other better way.
please help me!!!
-
Hi, I want to know PowerChart XT release time.
-
Hi,
I am afraid, FusionCharts does not support changing chart messages with HTML tags, as of now.

Does it support the css style or control the message position ?
-
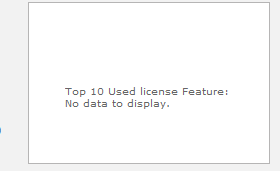
Hi,
I want to change the message style, just like "no data to display" .
Now I can change the message content,
 but our designer want me to change the style.
Does the message support html tag?
-
Hi,
Thank you for the post.
For rounded edges of the data plot, Could you please try by setting "useRoundEdges" attribute of the <chart> element to "1"?
Ref. Code(in XML):
<chart ... useRoundEdges='1' ...>
Please find the attached screen shot for the same.
Hope this helps!
I try your method
 , but the designer not like your "RoundEdges" effect, he hope just column has Round Edge, not all the chart.
 Do you have other method?
-
I want to realize rounded effect for column chart.
Our designer give me some design, see the png.
I realize the design,
 but the column has not rounded effect, please help me.
 -
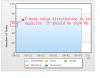
How to the chart message font size?
I want to change the font size about "no data to display" or "data error ", please help me.
-
Hi,
Thanks for your response.
Please note that FusionCharts automatically tries to adjust divisional lines and limit values based on the data provided. In FusionCharts, the axis limits encompasses all values present in the chart i.e., no data value can be below the minimum y-axis value or above maximum y-axis value - they have to be within the axis range. Even if you force an axis limit that is lower/higher than this, FusionCharts will automatically adjust it.
Hope this helps.
Hi,
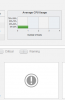
I am not set y-axis limits. FusionCharts should be automatically adjust lower limit and upper limit and y-axis label distribution. Now issue is y-axis label distribution not equality.
Thanks.
-
Hi,
Thanks for your post.
Could you please confirm the FusionCharts version you are using?
Please send us the XML code to test it from our end.
Awaiting for your response.
Hi,
Current Version: FusionCharts v3.2.1
OS: Windows7
Browser: Firefox 9.0.1
I user json code, you can find my example in attach file.Example.zip
Thanks.
-
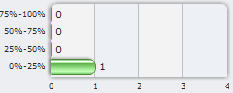
Hi ,
I find a problem about Y-axia value distribution is not equality, see picture.
-
I suggest that the FusionChart may be support JavaFX2.0.
-
Thank you.
-
FusionWeights do not support JSON ?
-
Hi,
Thanks for your post.
Could you please send us The XML code to test it from our end?
Awaiting for your response.
I use JSON method.
This the JSON Data.
{"chart":{"adjustDiv":"0","anchorAlpha":"0","baseFontColor":"363636","bgAlpha":"100","bgColor":"#EEECEB","canvasBgColor":"FFFFFF","canvasBorderColor":"9ca1a6","canvasBorderThickness":"1","canvasRightMargin":"10","caption":"CPU 使用率","chartLeftMargin":"0","chartRightMargin":"20","chartTopMargin":"0","clickURL":"j-popupBigChartWindow-createCpuUsage","decimals":"0","divLineDashGap":"2","divLineDashLen":"4","divLineIsDashed":"1","doughnutRadius":"60","forceDecimals":"1","forceYAxisValueDecimals":"1","formatNumberScale":"0","labelDisplay":"none","lineColor":"69AC57","numDivLines":"4","numVDivLines":"4","numberSuffix":"%","numberprefix":"","pieRadius":"60","plotFillColor":"58A344","plotGradientColor":"58A344","showAlternateVGridColor":"1","showBorder":"1","showToolTip":"","showZeroPies":"0","showpercentvalues":"","showplotborder":"0","showvalues":"0","slantLabels":"","useRoundEdges":"","vDivLineIsDashed":"0","xaxisname":"","yAxisMaxValue":"100","yAxisMinValue":"0","yAxisValueDecimals":"1","yaxisname":""},"data":[{"color":"","isSliced":"0","label":"14:10","toolText":"","value":"38.00"},{"color":"","isSliced":"0","label":"14:15","toolText":"","value":"37.00"},{"color":"","isSliced":"0","label":"14:20","toolText":"","value":"37.00"},{"color":"","isSliced":"0","label":"14:25","toolText":"","value":"37.00"}]}
I think this is not a chart data problem.


Can you support custom chart tooltip by template?
in Suggestions & Requests
Posted · Report reply
Can you support custom chart tooltip by template? for example: user can define tooltip string like "#{yValue}, #{xLabel} ", the chart will display something replace #{...} in tooltip.