
Eric.G
-
Content count
2 -
Joined
-
Last visited
Posts posted by Eric.G
-
-
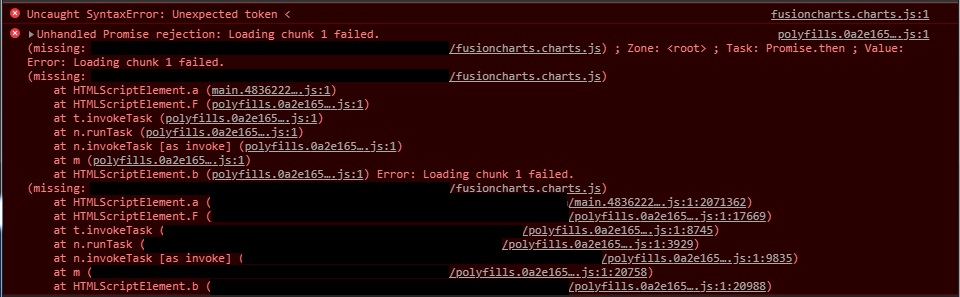
I'm using Fusion Charts in a project right now, and while in development everything seems to work fine. However, when the project is built using the production ("--prod") flag, the chart no longer works. The project is Angular 6 (soon to be updated to Angular 7), and Fusion Charts 3.13.2, and Angular-FusionCharts 2.0.4. I created a separate module for Fusion Charts that I'm exporting and then importing in the main app.module. When the page loads, I get 2 errors in the console, one in fusioncharts.charts.js, and the other in polyfills.#.js. Can anyone tell me what's wrong with this or why I'm getting this error? My code is below.
Console Errors
NgxFusionChartsModule
import { NgModule } from '@angular/core'
import { FusionChartsModule } from 'angular-fusioncharts'

import * as FusionCharts from 'fusioncharts'
import * as Charts from 'fusioncharts/fusioncharts.charts'
import * as FusionTheme from 'fusioncharts/themes/fusioncharts.theme.fusion'

FusionChartsModule.fcRoot(FusionCharts, Charts, FusionTheme)

@NgModule({
  imports: [FusionChartsModule],
  exports: [FusionChartsModule]
})
export class NgxFusionChartsModule {}
App.Module
//Third Party Components
import { NgxFusionChartsModule } from './ngx-fusion-charts.module'

@NgModule({
  declarations: [...],
  imports: [
    // Third Party Imports
    NgxFusionChartsModule
  ],
  providers: [...],
  bootstrap: [AppComponent]
})
export class AppModule {}
Data Source
dataSource = {
    chart: {
      //caption: 'Supply & Demand',
      yaxisname: 'Supply & Demand',
      //subcaption: '2012-2016',
      showhovereffect: '1',
      //numbersuffix: '%',
      drawcrossline: '1',
      plottooltext: '$seriesName for $label: <b>$dataValue</b>',
      theme: 'fusion'
    },
    categories: [
      {
        category: [...]
      }
    ],
    dataset: []
  }
HTML Tag
<fusioncharts width="100%" height="350" type="msline" dataFormat="JSON" [dataSource]="dataSource"></fusioncharts>
[Angular 6] Chart Type Not Supported Error When Building for Production
in General usage
Posted · Report reply
I think this fixed the issue. Thank you!