
Munmun
-
Content count
8 -
Joined
-
Last visited
Posts posted by Munmun
-
-
Dear Akash and team ,
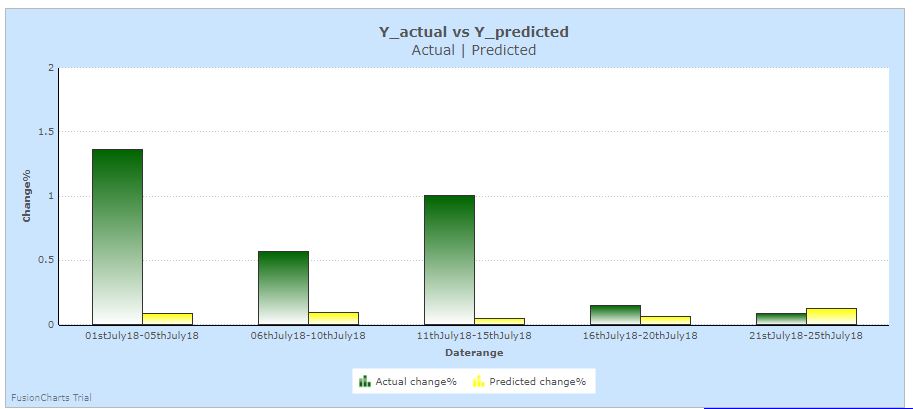
As suggested by you , in order to have a dual y-axis i have added the code . But I do not get the dual y-axis lines , somewhere I am going wrong, secondly i need the vline and trendline at a perticular position here in 20% i need a trendline, and i have written the code for that , still the trendline in column2d chart is not getting plotted.
Kindly check my code. i have also attached my queries and the image output that i m getting currently in the zip file . kindly rectify me this is important and urgent.
my requirement is that i need trendline at 20% for the column2d chart and dual y-axis on both sides of the column2d chart. i have written the code for that.please check. your help would be appreciated. -
Dear FusionCharts Team, I have few queries related to mscolumn2d chart and msline chart.
1) I want to extend the y-axis limit range in both the multiseries chart and also have customised divisions like 1 then 1.5 , 2 then 2.5 , and so on. The range needs to be extended and subdivsion of lines should be 1 then 1.25 2 then 2.5 and so on , customize it.2) currently i have y-axis values like 0 , 0.5 , 1 and 1.5 , 2 and so on but i need them as a percentage like 5%, 20% , 10%, 15%. i am taking data from database.
3) Can we have dual y-axis in a multicolumn or multiseries chart , two sides of a graph. in the image attached for actual change% and for predicted change% we need dual y-axis , is it possible to get this.
4)Is there a possibility to use a magnifying point/highlight a point in the msline graph at a certain point inside the graph.
kindly help me with these points and let me know if we you need any clarification on these.
-
Dear FusionCharts Team,
I am trying to create a msline chart in fusion using javascript fetching data from database.
But a blank screen with the error defined "uncaught exception, cannot read property call" is populated.Please have a look with fusioncharts sample attachment.
-
I need to build a multiseries chart by adding a datepicker and changing the graph by populating the from and to date in the date picker and refreshing the chart accordingly.
Kindly help.
-
Thanks Akash . Yes I did notice that change , but I thought there might be some other alternate to it.
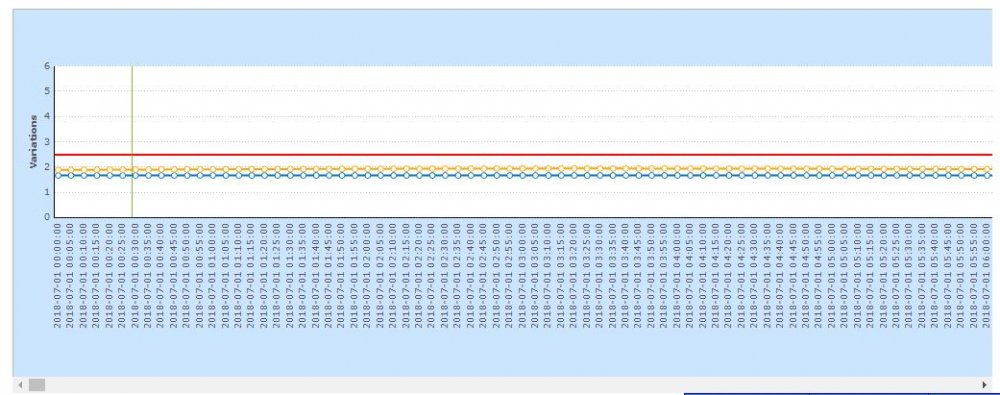
So As you mentioned earlier multiseries charts cannot have a scroll.Please let me know if there are many points in a multiseries chart , what can be done as an alternate to view all the points in a page ,as tbere are 2880 points to be plotted for the multiseries.
Your help would greatly be appreciated.
-
Dear Team,
This is a sample scrollline2d chart code written in java referenced from one of your examples . On executing this I do not get the scrollline and displays "No data is visisble " in the browser. kindly verifythe code sample
<%@ page language="java" contentType="text/html; charset=ISO-8859-1" pageEncoding="ISO-8859-1"%>
<%@page import="java.util.*" %>
<%@page import="com.FusionCharts" %>
<!DOCTYPE html PUBLIC "-//W3C//DTD HTML 4.01 Transitional//EN" "http://www.w3.org/TR/html4/loose.dtd">
<html><head>
<meta http-equiv="Content-Type" content="text/html; charset=ISO-8859-1">
<title>FusionCharts | My First Chart</title>
<script src="https://cdn.fusioncharts.com/fusioncharts/latest/fusioncharts.js"></script>
<script src="https://cdn.fusioncharts.com/fusioncharts/latest/themes/fusioncharts.theme.fusion.js"></script>
</head>
<body>
<div id="chart"></div>
<%
// store chart config name-config value pair
Map<String, String> chartConfig = new HashMap<String, String>();
chartConfig.put("theme", "fusion");
chartConfig.put("caption", "Dates [2017-18]");
chartConfig.put("subCaption", "In MMbbl = One Million barrels");
chartConfig.put("xAxisName", "Dates");
chartConfig.put("yAxisName", "values");
chartConfig.put("linethickness", "3");
chartConfig.put("flatScrollBars", "1");
chartConfig.put("scrollheight", "10");
chartConfig.put("numVisiblePlot", "12");
chartConfig.put("showHoverEffect", "1");// chartConfig.put("numberSuffix", "k");
//store label-value pair
Map<String, Integer> dataValuePair = new HashMap<String, Integer>();
dataValuePair.put("1994", 15622);
dataValuePair.put("1995", 10612);
dataValuePair.put("1996", 15820);
dataValuePair.put("1997", 26723);
dataValuePair.put("1998", 35415);
dataValuePair.put("1999", 25555);
dataValuePair.put("2000", 81803);
dataValuePair.put("2001", 47950);
dataValuePair.put("2002", 19435);
dataValuePair.put("2003", 9780);
dataValuePair.put("2004", 23243);
dataValuePair.put("2005", 28619);
dataValuePair.put("2006", 8477);
dataValuePair.put("2007", 3503);
dataValuePair.put("2008", 14278);
dataValuePair.put("2009", 30522);
dataValuePair.put("2010", 61518);
dataValuePair.put("2011", 24819);
dataValuePair.put("2012", 16437);
dataValuePair.put("2013", 21171);
dataValuePair.put("2014", 1690);
dataValuePair.put("2015", 2418);
dataValuePair.put("2016", 11253);
dataValuePair.put("2017", 11260);StringBuilder jsonData = new StringBuilder();
StringBuilder data = new StringBuilder();// json data to use as chart data source
jsonData.append("{'chart':{");
for (Map.Entry conf : chartConfig.entrySet()) {
jsonData.append("'" + conf.getKey() + "':'" + conf.getValue() + "',");
}jsonData.replace(jsonData.length() - 1, jsonData.length(), "},");
// build data object from label-value pair
data.append("'data':[");for (Map.Entry pair : dataValuePair.entrySet()) {
data.append("{'label':'" + pair.getKey() + "','value':'" + pair.getValue() + "'},");
}
data.replace(data.length() - 1, data.length(), "]");jsonData.append(data.toString());
jsonData.append("}");// Create chart instance
// charttype, chartID, width, height,containerid, data format, data
FusionCharts firstChart = new FusionCharts("scrollline2d", "first_chart", "700", "400", "chart", "json",
jsonData.toString());
%>
<%= firstChart.render() %>
</body>
</html> -
I am plotting a multiseries chart using data from database in java . The Chart attributes that I put are as follows: I have around 2880 points to plot.(Atleast 1000 minimum) for which i need scrollbars. currently the poits are all clustered and not visible.
chartConfig.put("theme", "fusion");
chartConfig.put("caption", "Countries With Most Oil Reserves [2017-18]");
chartConfig.put("subCaption", "In MMbbl = One Million barrels");
chartConfig.put("xAxisName", "Country");
chartConfig.put("yAxisName", "Reserves (MMbbl)");
chartConfig.put("linethickness", "3");
chartConfig.put("flatScrollBars", "1");
chartConfig.put("scrollheight", "10");
chartConfig.put("numVisiblePlot", "12");
chartConfig.put("showHoverEffect", "1"); chartobj.put("paletteColors", "#0075c2,#1aaf5d");
chartobj.put("bgcolor", "#ffffff");
chartobj.put("showBorder", "1");categories.add(buildCategories("datetime", rs, gson));
dataset.add(buildDataset("Y_actual","y_actual", rs1, gson));
dataset.add(buildDataset("Y_hat", "y_predicted", rs2, gson));dataMap.put("chart", gson.toJson(chartobj));
dataMap.put("categories", gson.toJson(categories));
dataMap.put("dataset", gson.toJson(dataset));
FusionCharts mslineChart= new FusionCharts(
"msline",// chartType
"chart1",// chartId
"700","400",// chartWidth, chartHeight
"chart",// chartContainer
"json",// dataFormat
gson.toJson(dataMap) //dataSource
);Scrollbar is not getting implemented in the chart . kindly suggest.

Fusioncharts using angularjs
in Installation and Upgrades
Posted · Report reply
hi i m new to angularjs. kindly let me know why i get a compile error. angularjs.html contains the code . also i want to know if i want to fetch data from database then how do i write the code.
Please correct me if i m wrong . I m new to angular js and angular. i m still learning.
How to test in angular2.Code for the same.
Angular_js.html