
nikhil525
-
Content count
16 -
Joined
-
Last visited
Posts posted by nikhil525
-
-
Is there any way to create a style property which changes the color of the line in Multiseries Line Chart.
For Example, using style properties we can set alpha and animation.same way can we make a animation which changes the color of the line from say red to green.
Do you have this style in fusion charts.
Could you please let me know.
Thank You
Nikhil Bhomi
-
In Pareto chart, while the data is sorted while rendering on the chart, the position of vLine does not get altered. It shows up at the same position (index) as specified in XML.
In Pareto the data is sorted when rendering. Is there any way to send the data with out sorting.
could you please let me know asap
Thank You
Nikhil Bhomi
-
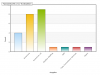
I started using Pareto Chart and have some questions regarding it.
When I create a Pareto chart the values are displayed from highest to lowest. Is there anyway it displays the values in the order we are passing to the chart.
for example in the picture attached you can see October is displayed first then march and so on based on the values (spend). Can we display them based on month.
Can you please let me know.
and also do we a Pareto in multiseries so that I can display one more line with other values on top of the Pareto line.
Thanks in advance.
Thank You
Nikhil Bhomi
-
Hello,
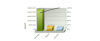
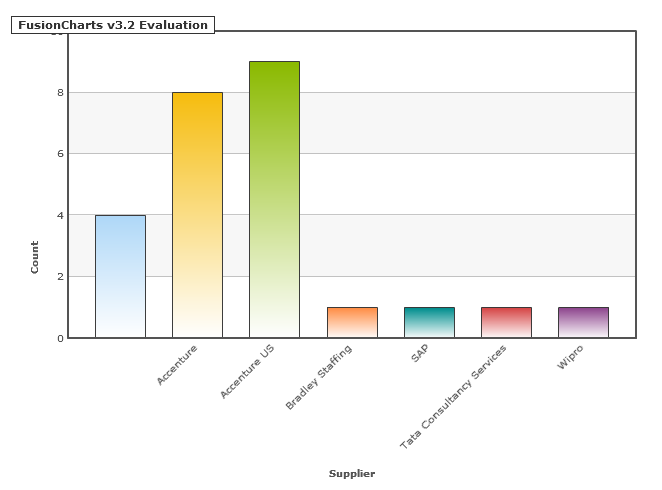
I wonder if there is a way to align the Y-Axis Title in the chart.
I know that we have padding attributes which align Y-axis title respective of left and right of the chart .
Is there any attribute which allows us to align the Y-axis title respective of top and bottom of chart.
And also is there a way to wrap the Y-axis title because some of my charts have really lengthy Y-Axis Titles.
as you can see in the image attached I want the Y-axis title "Count" to be little bit upwards .
Is there a feature existing to do this??
Thanks in advance.will be waiting for your response.
Thank You
Nikhil Bhomi
-
Angie,
Attached is the XML file I am using to generate the chart.
Thank You
Nikhil Bhomi
Hi,
Could you please send us the code to look into the issue?
Awaiting for your reply.
-
Hello,
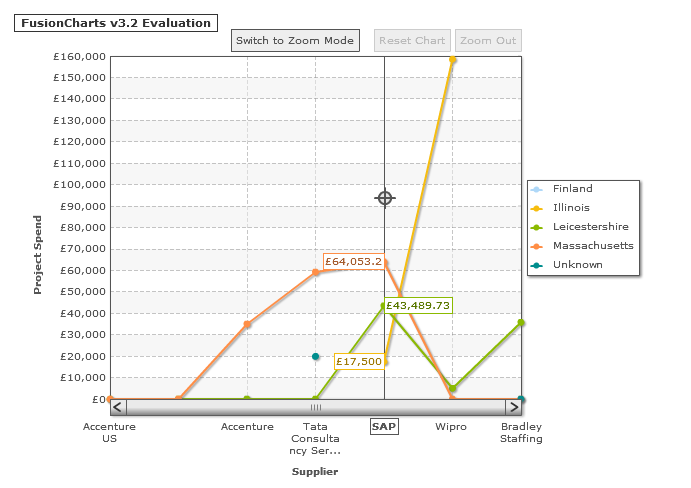
I am trying to display data using Zoomline Chart but when I hover on Data points I can just see values but cannot see the categories Name and Seriesname.
I tried setting showToolTip value to '1' even then it's not showing the category and series name in the tooltip
you can also see in the image attached the tooltip is only showing the value.
According to Fusion Charts Documentation it says
"toolText || String || By default, FusionCharts shows the series Name, Category Name and value as tool tip text for that data item. But, if you want to display more information for the data item as tool tip, you can use this attribute to specify the same."
are there any other properties I have to set to show the categories and series in tooltip automatically.
Thank You
Nikhil Bhomi
-
Can any one reply to my posting.
did any of you have the same issue before. Please respond to me.
Thank You
Nikhil
-
Hello,
I am trying to create fusion charts using "fusioncharts.cs" file by calling method "RenderChartHTMLALL". Everything looks fine chart is coming up but I cant see the message retrieving data or loading data when the chart is taking longer time to come up, Its showing empty screen.
I tried to include the chart messages in the url field as querystring (~/folder1/folder2/Charts/" + swfFileName + "?PBarLoadingText=Loading......&XMLLoadingText=Loading the XML) even then I can't see the loading message.
when I tried to do this using javascript method and passed "chart.setXMLUrl" then its working good.but I want to send data using "chart.setXMLData" when I did that charts coming up but still same problem exists it doesn't how up loading chart message.
Can you please help me out with this.It's very urgent.
chart.setXMLUrl("../../../../Documents/Bar2D1.xml"); It works if I give it this way
chart.setXMLData("<chart caption='Brand Winner' yAxisName='Brand Value ($ m)' xAxisName='Brand' bgColor='F1F1F1' showValues='0' canvasBorderThickness='1' canvasBorderColor='999999' plotFillAngle='330' plotBorderColor='999999' showAlternateVGridColor='1' divLineAlpha='0'> <set label='Coca-Cola' value='67000' toolText='2006 Rank: 1, Country: US'/> <set label='Microsoft' value='56926' toolText='2006 Rank: 2, Country: US'/> <set label='IBM' value='56201' toolText='2006 Rank: 3, Country: US'/> <set label='GE' value='48907' toolText='2006 Rank: 4, Country: US'/> <set label='Intel' value='32319' toolText='2006 Rank: 5, Country: US'/> <set label='Nokia' value='30131' toolText='2006 Rank: 6, Country: Finland'/> <set label='Toyota' value='27941' toolText='2006 Rank: 7, Country: Japan'/> <set label='Disney' value='27848' toolText='2006 Rank: 8, Country: US'/> <set label='McDonalds' value='27501' toolText='2006 Rank: 9, Country: US'/> <set label='Mercedes-Benz' value='21795' toolText='2006 Rank: 10, Country: Germany'/> </chart>"); it doesn't work when I give it this way
Thank You
Nikhil
-
Even I provided the configuration attributes(PBarLoadingText ,XMLLoadingText) in querystring its not showing up.but If I customize chart message for "InvalidXML" its showing up.
Is there something I am doing wrong can you please suggest me what to do.Is there any other attribute in fusioncharts to set this properties on.
Thank You
Nikhil Bhomi
-
I have the same problem and can someone tel me where to set both the values.swf loading and dataloading.
Thank You
Nikhil
-
I am using fusioncharts.cs file (private static string RenderChartHTMLALL method) to get the chart and where can I set the loading message.
Right now I can't even see the message.It's empty.
Thank You
Nikhil
-
Thankyou very much it's working If I set the Yaxismaxvalue as 100.000001.
-
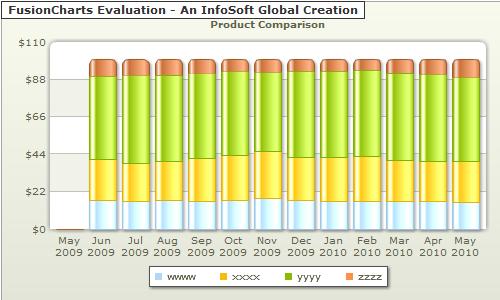
Hello,
I am trying to assign yaxismaxvalue in stacked2dcolumn chart but it is not working when ever I have all 0's in a row (i.e when the row sum is 0 ) or when the row sum is less than 100.
I attached the xml and image for the chart.
can you please let me know what the problem is
Thank You
Nikhil
-
Thank you Very much..
Actually I tried using MSColumn2D and it worked..
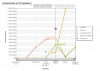
but I have other Questions

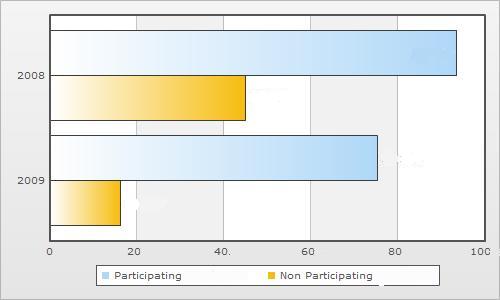
1Q) In linechart can we display the difference between 2 points on the chart..
2Q)Is there any wayto show an extra axis in the chart to display the difference between bars as shown in the image below:

Waiting for your reply
Thank You
-
Hey Guys,
I am looking for same kind of solution but for MSBar2D chart..
what we have:
Can we rotate it by 90 degrees:
so that we can have this
:
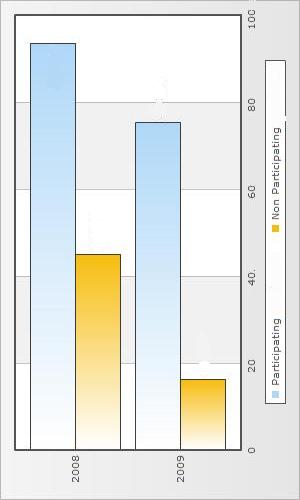
Can you guys please suggest me what to do..
Thank You
Nikhil

Applying Style Attributes At Series Level
in Suggestions & Requests
Posted · Report reply
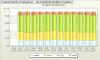
Q1) Can we apply Style attributes to dataplot in such a way that it only shows effect on particular series of data. For Example if you look at the image it has 2 lines and I applied a glow style which shows effect on both the lines.
Is there a way so that we can apply glow style to only one series say here in image for Current Year series and leave the second one with out any style.
Q2) Is there a way if we can apply style to particular data values.Like in the Image I set the color of line for Jul, Aug, Sep for previous year series to red. So Is there a way so that we can apply style to some particular values.
Coula d you please answer my questions.
Thank You
Nikhil Bhomi