
marco811
-
Content count
5 -
Joined
-
Last visited
Posts posted by marco811
-
-
Hello Srishti
Thank you, works.
But i have another issue. I generated data each 1 minute but when i zoom to minutes appear a blank space in the left side (https://jsfiddle.net/8m235gjw/)
Thanks
-
Hello. How are you?
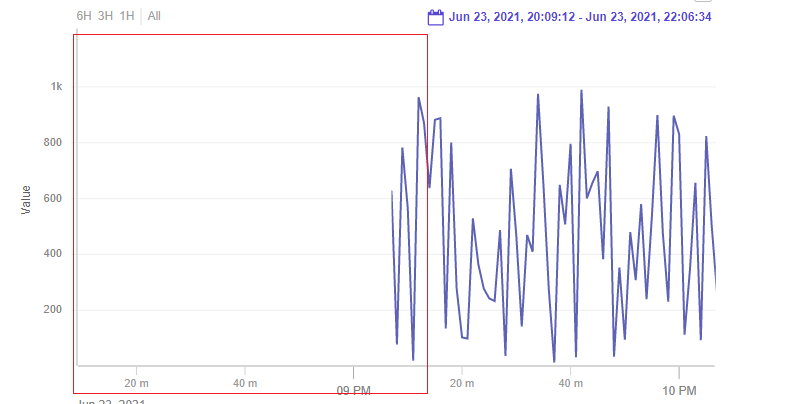
We are using fusiontimes to not show all data at the beginning and avoid bad browser performance. This has helped us a lot. But I have a problem that I have not been able to solve. When you zoom to the maximum, the actual value of the registry is not displayed, but rather it is grouped by day.
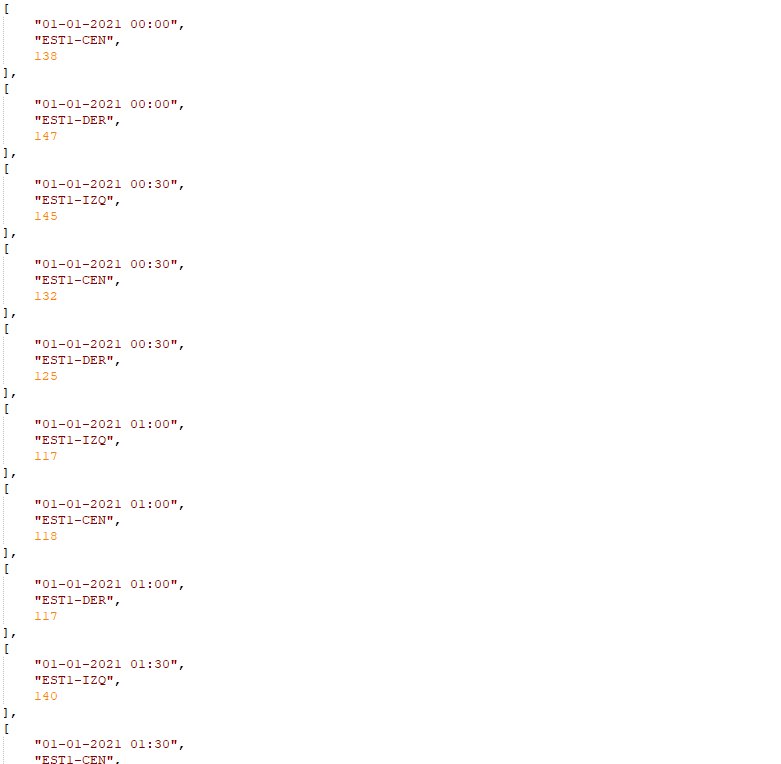
Our system generates records every 30 minutes
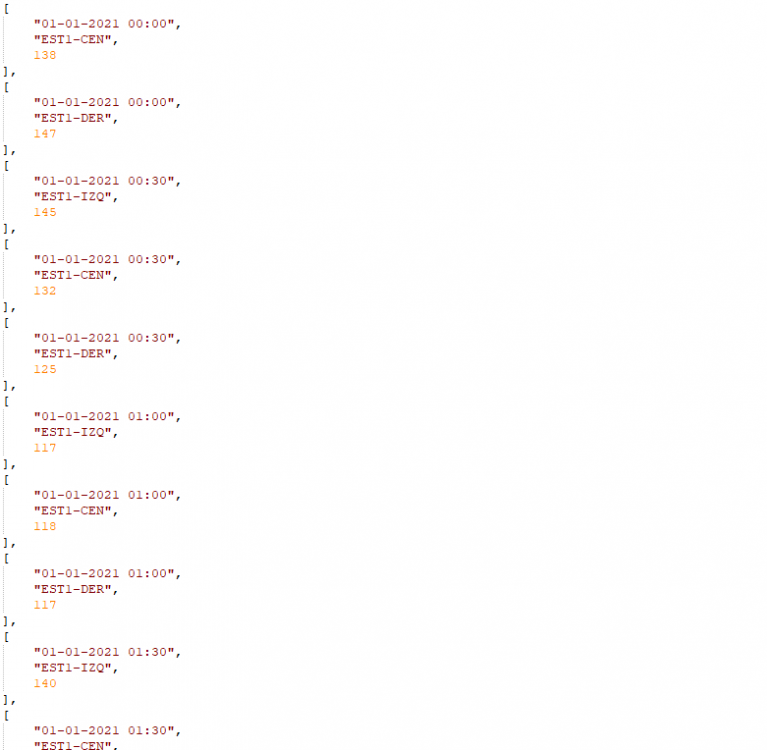
But when zooming to the maximum it groups by day and I can't zoom in any more.
I have the binning option set but still can't get it to work.
xaxis: {
			outputtimeformat: {
				year: "%Y",
				month: "%-b %Y",
				day: "%d/%m/%Y",
				hour: "%d/%m/%Y %Hh",
				minute: "%d/%m/%Y %H:%-M"
			},
			binning: {
				"year" : [1],
				"month" : [1],
				"day" : [1],
				"hour" : [1],
				"minute" : [30]
			}
		}
regards
-
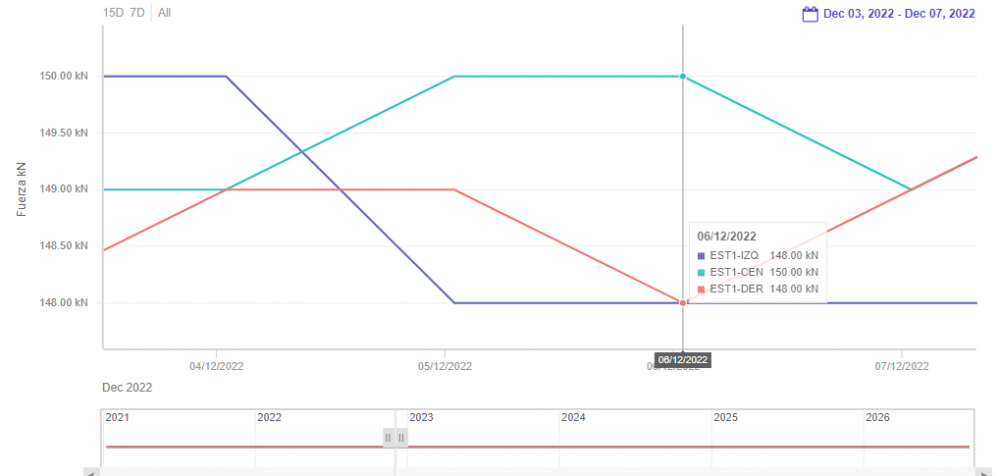
4 hours ago, Srishti Jaiswal said:Hi,
You can disable the default formatting of the y-axis values to display the raw data in the chart. To disable the default formatting of the y-axis values, set the value of defaultFormat attribute to 0 under format object.
Demo: http://jsfiddle.net/srishti_fc/xn6dzswh/18/
Thanks,
Srishti
Hi. I have solved the problem. Thank you
-
Hello
I am trying to implement "formatNumberScale" option in timeseries chart but is not working.
Still showing "k" for thousands.
Thanks
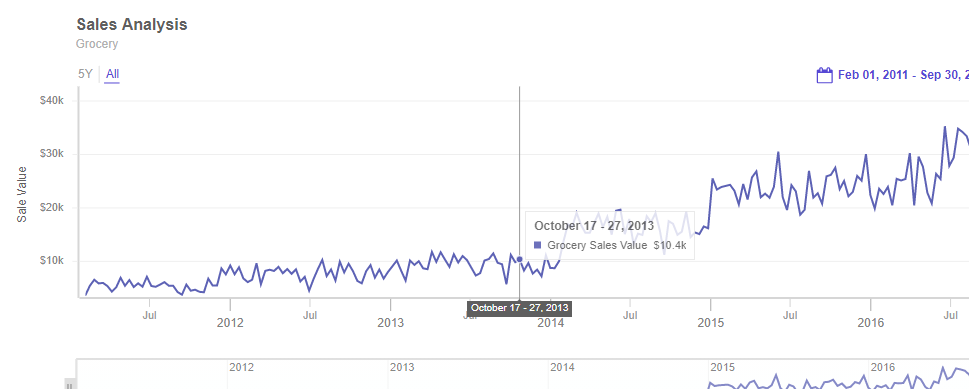
Promise.all([
fetch('https://s3.eu-central-1.amazonaws.com/fusion.store/ft/data/line-chart-with-time-axis-data.json'),
fetch('https://s3.eu-central-1.amazonaws.com/fusion.store/ft/schema/line-chart-with-time-axis-schema.json')
]).then(function(res) {
	Promise.all([
		res[0].json(),
		res[1].json()
	]).then(function(res) {
		showChart(res[0], res[1]);
	});

});

function showChart(dataFetch, schemaFetch) {

  const dataStore = new FusionCharts.DataStore();
  const dataSource = {
    chart: {
		"formatNumberScale": "0"
	},
    caption: {
      text: "Sales Analysis"
    },
    subcaption: {
      text: "Grocery"
    },
    yaxis: [
      {
        plot: {
          value: "Grocery Sales Value"
        },
        format: {
          prefix: "$"
        },
        title: "Sale Value"
      }
    ]
  };
  dataSource.data = dataStore.createDataTable(dataFetch, schemaFetch);

  new FusionCharts({
    type: "timeseries",
    renderAt: "chart-container",
    width: "100%",
    height: "500",
    dataSource: dataSource
  }).render();
}

Fusiontimes binning not working for hours/minutes
in General usage
Posted · Report reply
Hello. When is version 3.18 going to be released?