
Dipak Rathod
-
Content count
4 -
Joined
-
Last visited
Posts posted by Dipak Rathod
-
-
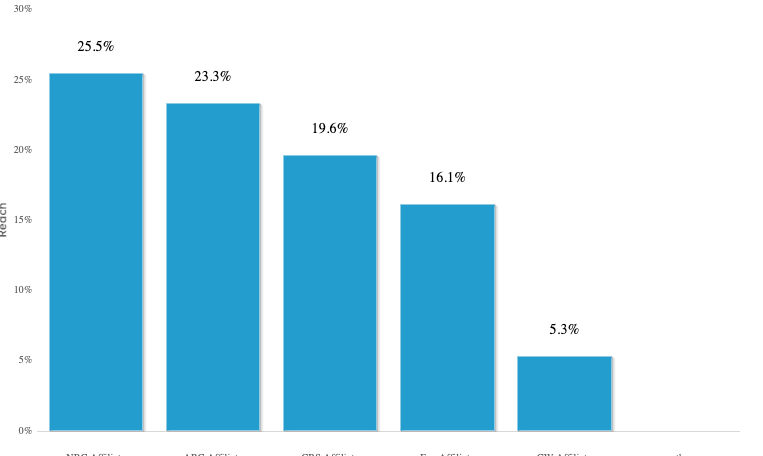
Hi,
I have used "scrollcolumn2d" chart type to render the chart. My requirement is to display different colors in same chart for different bars. currently as you can see in the screenshot, there is only one color for all bars.
result["paletteColors"] = "#229DCD,#3CB5E6,#6DCFF6,#229DCD,#3CB5E6"
this is the property m using for my color palette.
Thanks & Regards,
Dipak Rathod
-
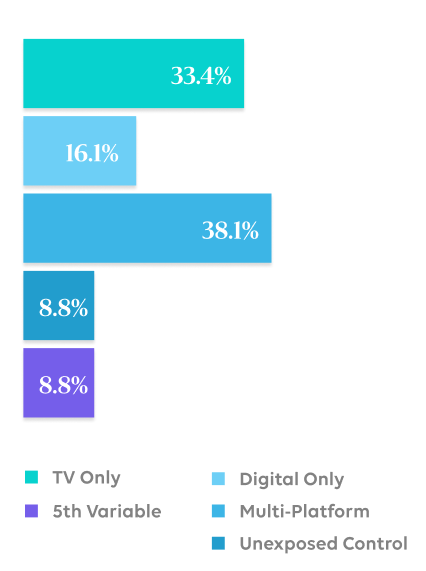
Hi All,
Can you help with the following queries?
I am currently using bar2d chart & facing following issue with legends.
1. Cannot show legends in bar2d chart type2. If want to use any other 2d chart type like 'mscolumn2d, msbar2d etc.' then in that Legends are shown but they are being presented as "Series name". I wanted to show the legends for the Y-axis elements as you can see in the attached screenshot.
Thanks & Regards,
Dipak Rathod
-
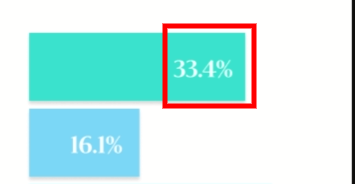
Hi,
I am creating a Bar chart (bar2d) as shown in attached screenshot. The requirement is to put the number on top of the horizontal bars.
You can 16.1% is on top of the bar & aligned to the right.
Is there any chart attributes to achieve this? If not then please suggest any workaround.
Thanks,
Dipak Rathod
Color pallete is applying on scrollcolumn2d chart
in General usage
Posted · Report reply
M currently building a chat of type "scrollcolumn2d".
All the bars in this chart will have colors picked from palette color defined.
I have coded the color palette as below: