
SofTools.net
-
Content count
13 -
Joined
-
Last visited
Posts posted by SofTools.net
-
-
Hi
Thanks for the reply.
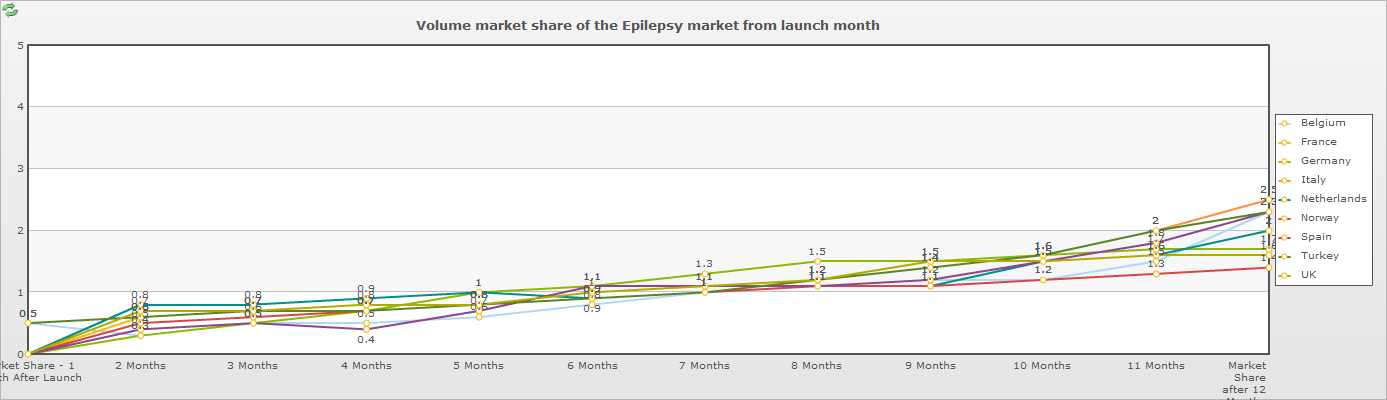
I DO NOT want to explicitly set the min and max values of the axis (by using adjustdiv, or yaxismaxvalue)
Because the data that comes out of the Database is not a fixed set of values, I need FusionCharts to automatically scale, which is what the above graph does. My issue is that this auto scaling goes from 0 to 5, which is surely wrong if the data only goes from 0 to 2.5 - Half of the graph is blank, which loses some of the visibility of the data - if it was more spread out, we would be able to differentiate more between the lines
Hope this makes sense!
Thanks
Mark
-
-
See the attachments
When this graph is shown , the values on teh yaxis are between 0 and 2.5, but the auto scale goes up to 5, meaning half of the graph is blank.
I know if I use the yAxisMaxValue='3' parameter, this would fix the issue, but the data is dynamic from the database, so this is not an option.
Why would the scale go to 5?
The msLine.swf is dated Nov 2010 and we a re a licensed user.
Do you have any recommendations?
Thanks in advance

-
Hi
Thanks for the reply - this fixes it!
-
Hi,
Could you please try replacing all the dates mentioned as "DD/MM/11" or "DD/MM/12" in your XML (as mentioned in the FusionCharts Forum) with "DD/MM/2011" or "DD/MM/2012" and see if this helps?
Hope this helps.

-
When using the Gantt.swf, i have encountered the following problem (see Image1.jpg for screenshot)
The bar is drawn left (off the scale)
<center><div id="fcexpDiv5"></div></center>    <center><div id="divFusionChartContainer5"></div></center>    <script type="text/javascript" src="../FusionCharts/FusionCharts.js"></script>
   <script type="text/javascript" src="../FusionCharts/FusionChartsExportComponent.js"></script>
   <script type="text/javascript">

       var objFusionChart = new FusionCharts("../FusionCharts/Gantt.swf", "FusionChartId5", "95%", "375", "0", "1");
       objFusionChart.setXMLData("<chart logoURL='../images/icons/hRefresh.gif' logoAlpha='50' logoPosition='TR' logolink='' showBorder='0' bgColor='FFFFFF' showAboutMenuItem='4' aboutMenuItemLabel='about SofTools' aboutMenuItemLink='N-http://www.SofTools.net' dateFormat='dd/mm/yy' showExportDataMenuItem='1' exportDataSeparator='{tab}' exportEnabled='1' exportAtClient='1' exportHandler='fcExporter1' exportDialogMessage='Once complete click save below....'  ganttWidthPercent='70' gridBorderAlpha='0' showTaskNames='1'  showLabels='1' ><categories><category fontcolor='ffffff' bgcolor='404040' name='2011' start='01/01/2011' end='31/12/2011' /><category fontcolor='ffffff' bgcolor='404040' name='2012' start='01/01/2012' end='30/09/2012' /></categories><categories><category fontcolor='ffffff' bgcolor='808080' name='Q1-2011' start='1/1/2011' end='31/03/11' /><category fontcolor='ffffff' bgcolor='808080' name='Q2-2011' start='1/4/2011' end='30/06/11' /><category fontcolor='ffffff' bgcolor='808080' name='Q3-2011' start='1/7/2011' end='30/09/11' /><category fontcolor='ffffff' bgcolor='808080' name='Q4-2011' start='1/10/2011' end='31/12/11' /><category fontcolor='ffffff' bgcolor='808080' name='Q1-2012' start='1/1/2012' end='31/03/12' /><category fontcolor='ffffff' bgcolor='808080' name='Q2-2012' start='1/4/2012' end='30/06/12' /><category fontcolor='ffffff' bgcolor='808080' name='Q3-2012' start='1/7/2012' end='30/09/12' /></categories><processes headerfontcolor='ffffff' headerbgcolor='404040' fontSize='12' isBold='1' align='left' headerText='Gantt Chart' headerFontSize='18' headerVAlign='middle' headerAlign='left' ><process fontcolor='000000' label='1.step 1' id='1' bgcolor='eeeeee'/><process fontcolor='000000' label='' id='2' bgcolor='ffffff'/><process fontcolor='000000' label='' id='3' bgcolor='eeeeee'/><process fontcolor='000000' label='' id='4' bgcolor='ffffff'/><process fontcolor='000000' label='' id='5' bgcolor='eeeeee'/><process fontcolor='000000' label='' id='6' bgcolor='ffffff'/><process fontcolor='000000' label='' id='7' bgcolor='eeeeee'/><process fontcolor='000000' label='' id='8' bgcolor='ffffff'/><process fontcolor='000000' label='' id='9' bgcolor='eeeeee'/><process fontcolor='000000' label='' id='10' bgcolor='ffffff'/></processes><dataTable showProcessName='0' nameAlign='left' headerFontSize='16' headerFontIsBold='1' /><tasks showLabels='0' showStartDate='0' showEndDate='0'><task tooltext='step 1Planned  Start=1 Jan 2011End=1 Sep 2012' processId='1' start='01/01/11 00:00' end='01/09/12 23:59' Id='1' color='cccccc' borderColor='aaaaaa' height='30%' topPadding='15%' /><task tooltext='step 1Actual  Start=1 Jan 2011End=5 Jul 2012' processId='1' start='01/01/11 00:00' end='05/07/12 23:59' Id='2' color='444444' borderColor='333333' height='40%' topPadding='60%'/><task tooltext='Planned  Start=1 Jul 2011End=5 Jul 2011' processId='2' start='01/07/11 00:00' end='05/07/11 23:59' Id='3' color='cccccc' borderColor='aaaaaa' height='30%' topPadding='15%' /><task tooltext='Actual  Start=1 Jul 2011End=5 Jul 2011' processId='2' start='01/07/11 00:00' end='05/07/11 23:59' Id='4' color='444444' borderColor='333333' height='40%' topPadding='60%'/></tasks><legend><item label='Planned' color='cccccc' /><item label='Actual' color='444444' /></legend><trendlines> <line start='06/07/11' displayValue='Today' color='333333' thickness='2' dashed='1' /></trendlines><styles><definition><style name='YScaleAnim' easing='strong' type='ANIMATION' param='_yscale' start='0' duration='1' /><style name='AlphaAnim' type='ANIMATION' duration='1' start='0' param='_alpha' /><style name='MyYScaleAnim' easing='strong' type='ANIMATION' duration='0.7' start='0' param='_yscale' /><style name='MyXScaleAnim' easing='strong' type='ANIMATION' duration='0.7' start='0' param='_xscale' /></definition><application><apply toObject='Canvas' styles='YScaleAnim,AlphaAnim' /><apply toObject='DIVLINES' styles='AlphaAnim' /><apply toObject='HGRID' styles='MyYScaleAnim,MyAlphaAnim' /></application></styles></chart>");
       objFusionChart.render("divFusionChartContainer5");
       objFusionChart = null;
   </script>
If I make a minor change to the code to change the end date of the task from 2012 to 2011, the gantt appears correctly (see attachment image2 and the code below)
Is there a bug, or am I doing something wrong?
<center><div id="fcexpDiv5"></div></center>    <center><div id="divFusionChartContainer5"></div></center>    <script type="text/javascript" src="../FusionCharts/FusionCharts.js"></script>
   <script type="text/javascript" src="../FusionCharts/FusionChartsExportComponent.js"></script>
   <script type="text/javascript">

       var objFusionChart = new FusionCharts("../FusionCharts/Gantt.swf", "FusionChartId5", "95%", "375", "0", "1");
       objFusionChart.setXMLData("<chart logoURL='../images/icons/hRefresh.gif' logoAlpha='50' logoPosition='TR' logolink='' showBorder='0' bgColor='FFFFFF' showAboutMenuItem='4' aboutMenuItemLabel='about SofTools' aboutMenuItemLink='N-http://www.SofTools.net' dateFormat='dd/mm/yy' showExportDataMenuItem='1' exportDataSeparator='{tab}' exportEnabled='1' exportAtClient='1' exportHandler='fcExporter1' exportDialogMessage='Once complete click save below....'  ganttWidthPercent='70' gridBorderAlpha='0' showTaskNames='1'  showLabels='1' ><categories><category fontcolor='ffffff' bgcolor='404040' name='Jan 2011' start='1/1/2011 00:00:00' end='31/01/11 23:59:59' /><category fontcolor='ffffff' bgcolor='404040' name='Feb 2011' start='1/2/2011 00:00:00' end='28/02/11 23:59:59' /><category fontcolor='ffffff' bgcolor='404040' name='Mar 2011' start='1/3/2011 00:00:00' end='31/03/11 23:59:59' /><category fontcolor='ffffff' bgcolor='404040' name='Apr 2011' start='1/4/2011 00:00:00' end='30/04/11 23:59:59' /><category fontcolor='ffffff' bgcolor='404040' name='May 2011' start='1/5/2011 00:00:00' end='31/05/11 23:59:59' /><category fontcolor='ffffff' bgcolor='404040' name='Jun 2011' start='1/6/2011 00:00:00' end='30/06/11 23:59:59' /><category fontcolor='ffffff' bgcolor='404040' name='Jul 2011' start='1/7/2011 00:00:00' end='31/07/11 23:59:59' /><category fontcolor='ffffff' bgcolor='404040' name='Aug 2011' start='1/8/2011 00:00:00' end='31/08/11 23:59:59' /><category fontcolor='ffffff' bgcolor='404040' name='Sep 2011' start='1/9/2011 00:00:00' end='30/09/11 23:59:59' /><category fontcolor='ffffff' bgcolor='404040' name='Oct 2011' start='1/10/2011 00:00:00' end='31/10/11 23:59:59' /><category fontcolor='ffffff' bgcolor='404040' name='Nov 2011' start='1/11/2011 00:00:00' end='30/11/11 23:59:59' /><category fontcolor='ffffff' bgcolor='404040' name='Dec 2011' start='1/12/2011 00:00:00' end='31/12/11 23:59:59' /></categories><processes headerfontcolor='ffffff' headerbgcolor='404040' fontSize='12' isBold='1' align='left' headerText='Gantt Chart' headerFontSize='18' headerVAlign='middle' headerAlign='left' ><process fontcolor='000000' label='1.step 1' id='1' bgcolor='eeeeee'/><process fontcolor='000000' label='2.step 2' id='2' bgcolor='ffffff'/><process fontcolor='000000' label='' id='3' bgcolor='eeeeee'/><process fontcolor='000000' label='' id='4' bgcolor='ffffff'/><process fontcolor='000000' label='' id='5' bgcolor='eeeeee'/><process fontcolor='000000' label='' id='6' bgcolor='ffffff'/><process fontcolor='000000' label='' id='7' bgcolor='eeeeee'/><process fontcolor='000000' label='' id='8' bgcolor='ffffff'/><process fontcolor='000000' label='' id='9' bgcolor='eeeeee'/><process fontcolor='000000' label='' id='10' bgcolor='ffffff'/></processes><dataTable showProcessName='0' nameAlign='left' headerFontSize='16' headerFontIsBold='1' /><tasks showLabels='0' showStartDate='0' showEndDate='0'><task tooltext='step 1Planned  Start=1 Jan 2011End=31 Dec 2011' processId='1' start='01/01/11 00:00' end='31/12/11 23:59' Id='1' color='cccccc' borderColor='aaaaaa' height='30%' topPadding='15%' /><task tooltext='step 1Actual  Start=1 Jan 2011End=15 Dec 2011' processId='1' start='01/01/11 00:00' end='15/12/11 23:59' Id='2' color='444444' borderColor='333333' height='40%' topPadding='60%'/><task tooltext='step 2Planned  Start=1 Jul 2011End=5 Jul 2011' processId='2' start='01/07/11 00:00' end='05/07/11 23:59' Id='3' color='cccccc' borderColor='aaaaaa' height='30%' topPadding='15%' /><task tooltext='step 2Actual  Start=1 Jul 2011End=5 Jul 2011' processId='2' start='01/07/11 00:00' end='05/07/11 23:59' Id='4' color='444444' borderColor='333333' height='40%' topPadding='60%'/></tasks><legend><item label='Planned' color='cccccc' /><item label='Actual' color='444444' /></legend><trendlines> <line start='06/07/11' displayValue='Today' color='333333' thickness='2' dashed='1' /></trendlines><styles><definition><style name='YScaleAnim' easing='strong' type='ANIMATION' param='_yscale' start='0' duration='1' /><style name='AlphaAnim' type='ANIMATION' duration='1' start='0' param='_alpha' /><style name='MyYScaleAnim' easing='strong' type='ANIMATION' duration='0.7' start='0' param='_yscale' /><style name='MyXScaleAnim' easing='strong' type='ANIMATION' duration='0.7' start='0' param='_xscale' /></definition><application><apply toObject='Canvas' styles='YScaleAnim,AlphaAnim' /><apply toObject='DIVLINES' styles='AlphaAnim' /><apply toObject='HGRID' styles='MyYScaleAnim,MyAlphaAnim' /></application></styles></chart>");
       objFusionChart.render("divFusionChartContainer5");
       objFusionChart = null;
   </script>

-
Thanks for the response
I am trying to print via pdf from a Javascript rendered version, not flash....... to make sure the pdf writer is ok
THe sequence via a process on the server goes
1) create the HTML (Containing HTL and the javascript rendered chart)
2) call the pdf creator and give it the HTML page as a parameter
3) THe pdf creator then effectively loads the page in a browser and simulates a print
The resulting HTML page is printed, but there is no chart on the page
The pdf printer is from BCL Terchnologies, and is teh "easypdf SDK 6"
Thanks for any help
Mark
-
Hi
We use a pdf generator to print an HTML page that contains a FusionCharts object.
The object shows fine as either flash or Javascript based if the client loads the HTML page, and can print from this page no problem from within the browser
When the pdf generator is used (server side) it is passed the HTML page - teh pdf is generated and the page prints, but the Chart is not shown (just the other HTML is shown)
There are no errors, but the chart is missing
I guess this is because when the page goes to print, the javascript has not yet completed, so the graph is not visible.
Is there any way we can force the chart to complete without dynamic building, so that the chart is ready to go when the pdf generator is called?
Thanks in advance
Mark
-
I am also trying to change the value position for Bubble charts - is there any plan to allow this???
-
Further to this - if I clear IE's temporary internet files then F5 - the chart displays correctly again - what is being cached that fails after the first load?
-
First of all, great product - our partners and clients love the dynalic charting, especially with teh JS fallback for the iPad
We have an ASP page delivering a chart that sometimes displays incorrectly, but with no errors reported
When the page is first delivered, the chart displays ok, but pressing F5 (in ie 8) causes the chart to fail. THe source code (view source) is the same in both cases, and the chart is delivered using the following within the HTML page
<DIV ID="divcontent" class="text">
<center><div id="divFusionChartContainer"></div></center>
<script type="text/javascript" src="../FusionCharts/FusionCharts.js"></script>
<script type="text/javascript">
var objFusionChart = new FusionCharts("../FusionCharts/MSArea.swf", "FusionChartId", "98%", "98%", "0", "1");
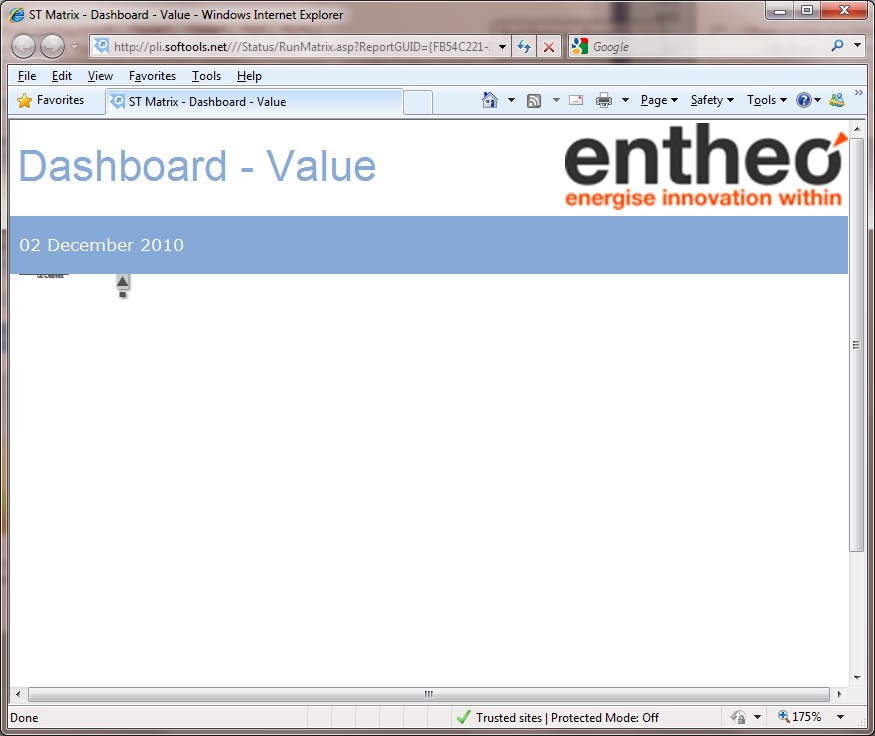
objFusionChart.setXMLData("<chart CanvasbgColor='ffffff,aaaaaa' CanvasbgAlpha='100,100' CanvasbgRatio='0,100' CanvasbgAngle='315' showBorder='0' bgColor='FFFFFF' showAboutMenuItem='4' aboutMenuItemLabel='about SofTools' aboutMenuItemLink='N-http://www.SofTools.net' exportEnabled='1' legendposition='RIGHT' caption='Dashboard - Value #' showLabels='1' showValues='0' plotFillAlpha='70' numVDivLines='10' showAlternateVGridColor='1' AlternateVGridColor='e1f5ff' divLineColor='e1f5ff' vdivLineColor='e1f5ff' baseFontColor='666666' canvasBorderThickness='1' showPlotBorder='1' plotBorderThickness='0'><categories><category label='New Market' /><category label='New Product' /><category label='New Service' /><category label='Process Improvement' /><category label='Strategic Change' /></categories><dataset anchorBorderColor='F6BD0F' plotBorderColor='F6BD0F' plotBorderThickness='2' seriesName='A. Individual Suggestion'><set value='67500' /><set value='1275000' /><set value='58500' /><set value='45000' /><set value='0' /></dataset><dataset anchorBorderColor='F6BD0F' plotBorderColor='F6BD0F' plotBorderThickness='2' seriesName='B. Focused Innovation Workshop'><set value='2000000' /><set value='1200000' /><set value='0' /><set value='37000' /><set value='1245000' /></dataset><dataset anchorBorderColor='F6BD0F' plotBorderColor='F6BD0F' plotBorderThickness='2' seriesName='C. Strategic Review'><set value='1200000' /><set value='12500' /><set value='12500' /><set value='0' /><set value='30000' /></dataset><dataset anchorBorderColor='F6BD0F' plotBorderColor='F6BD0F' plotBorderThickness='2' seriesName='D. Other'><set value='57500' /><set value='1234000' /><set value='60000' /><set value='0' /><set value='0' /></dataset><styles> <definition> <style name='Bevel' type='bevel' distance='2' blurx='4' blury='1'/> <style name='DataValues' type='font' borderColor='1D8BD1' bgColor='1D8BD1' color='FFFFFF' /> <style name='MyXScaleAnim' type='ANIMATION' duration='0.7' start='0' param='_xScale' /> <style name='MyYScaleAnim' type='ANIMATION' duration='0.7' start='0' param='_yscale' /> <style name='MyAlphaAnim' type='ANIMATION' duration='0.7' start='0' param='_alpha' /> <style name='LegendFont' type='font' isHTML='1' /> </definition> <application> <apply toObject='DATAPLOT' styles='Bevel' /> <apply toObject='DATAVALUES' styles='DataValues' /> <apply toObject='DIVLINES' styles='MyXScaleAnim,MyAlphaAnim' /> <apply toObject='HGRID' styles='MyYScaleAnim,MyAlphaAnim' /> <apply toObject='LEGEND' styles='LegendFont' /> </application></styles></chart>");
objFusionChart.render("divFusionChartContainer");
objFusionChart = null;
</script>
</DIV>
Pressing CTRL F5 will result in teh chart continuing to fail (but with no error reported.
If the browser window is closed and reopened - it's ok again the first time
I've adde the before and after screen grabs - you can see the chart in FS1, and the view after F5 (some of the chart elements can be seen top left of where it should be)
ANy suggestions would be gratefully received!


-
Further to this, I understand that you can associate labels with Bubbles on the actual chart.
We often need a bubble chart to show a large number of Bubbles, some of which have the same X and Y values. Does the Bubble chart offer intelligent positioning of the labels so that they don't overlap and are unreadable.
You do this for pie charts and wondered if there is an option to do this on labels for Bubbles
Thanks in advance


Y Axis Auto Scaling
in FusionCharts and ASP
Posted · Report reply
Hi
THanks for the reply, but I can't do this on the chart because the data is generated from a database, so the values might be 0 to 2.5 (as is the case here), or they might be 0 to 500.
Having just 2 div lines is not appropriate
The question I am asking is why the scale goes from 0 to 5 when the data only goes from 0 to 2.5
Is this a bug in the maths behind the auto scaling? - if so when will it be fixed?
Thanks
Mark